


Bipolar disorder appears to affect women and men at roughly similar rates overall, although women receive the diagnosis more often. A frequently cited review found more women in every one of ten large patient samples. The difference turns on who had a chance to be counted.
Imagine opening a paper to a table of people who already have a bipolar diagnosis. Six in ten are women. You now know something about the people whose experiences shaped that paper. To learn how common the condition is among women, you would need a second figure that table may never give you. How many women in the community did those patients come from?
What the ten large studies actually counted
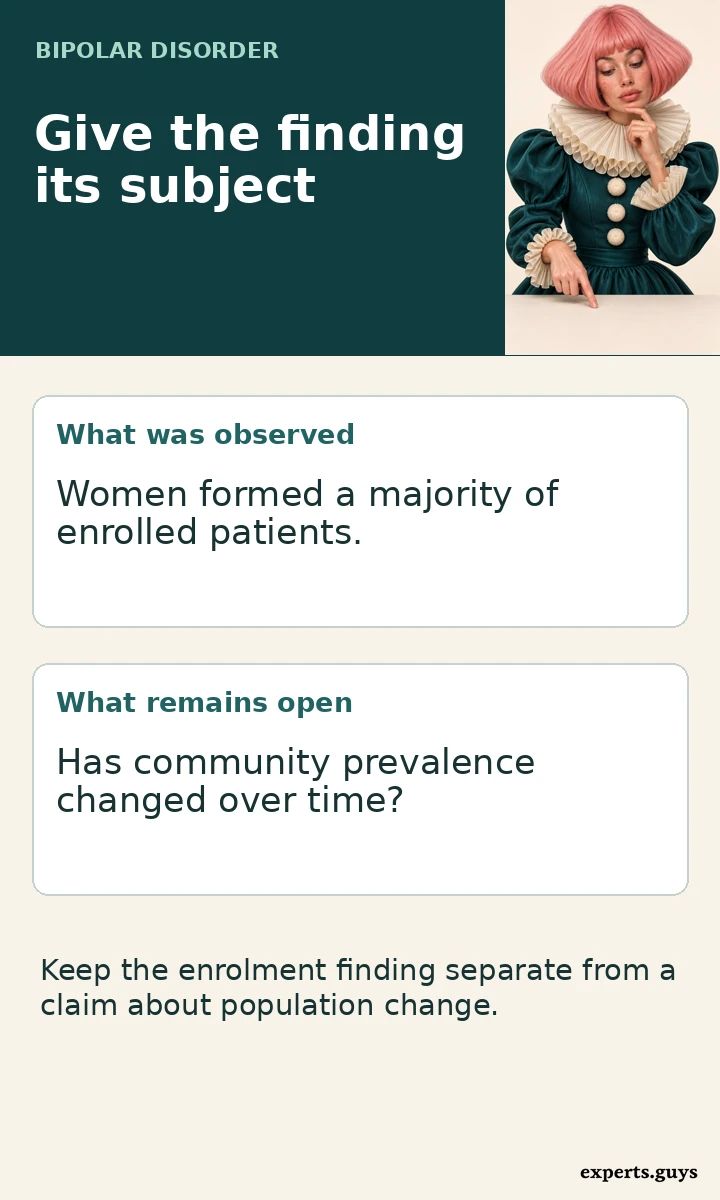
The original large-sample review brought together ten studies reporting a combined 47,878 participants. Women made up 57.4% to 65.0% of participants in the nine samples that included more than one bipolar subtype. In the separate bipolar I-only sample, the figure was 55.1%. Keeping that tenth study separate matters when quoting the range.
The repeated finding deserves attention. If a service wants to know whose experiences appear in research about living with an established diagnosis, these figures offer a starting point. They also raise questions about who reaches care and whose experience may be missing. Neither question requires assuming that the researchers counted everyone living with the condition in the surrounding community.
There were good reasons to study these groups in their own right. A treatment programme can follow people over time. A primary care database can include patients seen far from a university hospital. A biobank can connect clinical information with research measurements. Each opens a different window onto bipolar disorder. None acquires a population denominator simply because its records come from many locations.
Where a population estimate starts
A population survey starts earlier in the process. Its sampling plan identifies people in a defined population, including people who have never attended a mood clinic. An interview or other assessment then establishes who meets the study definition. The denominator includes eligible people who do not meet it. That last group, absent from a patient-only table, is essential to estimating prevalence.
The World Health Organization’s overview describes overall prevalence as approximately equal among men and women while noting that women are diagnosed more often. An older US adult interview survey illustrates the distinction. The NIMH prevalence chart gives past-year estimates of 2.8% for females and 2.9% for males using interviews conducted in 2001–2003. Those are estimates for that survey population and period. They cannot serve as a current global head count.
| Source | Who counts? | Result |
|---|---|---|
| Clinical review | People already in bipolar patient samples | Female majority in all ten samples |
| US adult survey | Adults in each survey group | Past-year prevalence of 2.8% for females and 2.9% for males |
| England screening survey | Survey participants in each reported group | Positive screens in 2.1% of women and 1.7% of men |
Consider what a reader can reasonably take from the two sources together. The survey percentages sit close to each other. The patient percentages repeatedly put women above half. Both statements can be accurate even within the same country and calendar year. One describes how frequently a condition occurs within a group. The other describes who fills the places in a group assembled around a condition.
The two meanings of “six in ten”
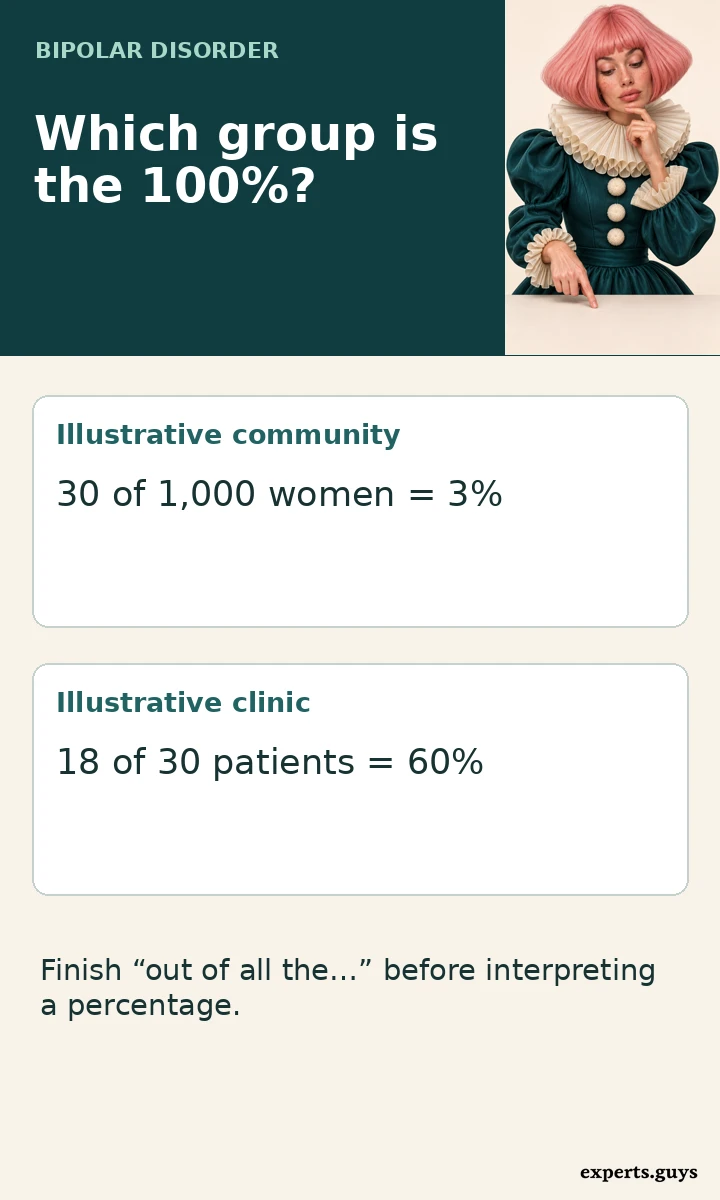
Suppose a research team interviews 1,000 women and 1,000 men and identifies 30 people meeting the same case definition in each group. Prevalence in this invented example is 3% for each. Now suppose 18 of those women and 12 of those men appear in a particular clinic study. The study has 30 patients and 18 are women. Women make up 60% of the study even though the underlying group estimates match exactly.
Where did the other 30 people go? The example doesn’t tell us. They may receive care elsewhere, have no diagnosis, decline to participate or fall outside the clinic’s entry criteria. Choosing one explanation would add a fact the example never gave us. This is also the discipline real data demand. A difference can invite investigation without identifying its own cause.
Reverse the exercise. A hospital says it cared for 60 women and 40 men with a bipolar diagnosis. If the populations it served contained 3,000 women and 2,000 men, those counts would represent 2% of each group. If it served 2,000 women and 4,000 men, the same counts would represent 3% and 1%. Even then, you would have calculated the share seen by that hospital. Estimating all cases would require knowing how completely the hospital captured them.
One practical way to read a percentage aloud is to finish the phrase “out of all the…” before saying the number. Out of all the patients enrolled, 60% were women. Out of all the women interviewed, 3% met the study definition. The ordinary English sentence makes a substitution obvious. It also works when the display gives whole numbers rather than percentages.
In a published report, the most useful place to find that missing phrase is often the heading immediately above the numbers. “Characteristics of participants with bipolar disorder” puts every row inside a diagnosed or study-defined case group. “Prevalence by sex among survey respondents” suggests a different base. The methods or footnotes should settle exactly which respondents contributed to each estimate.
Who gets through the research entrance?
Picture three invitations. One goes to a randomly selected address. A second goes to patients who received care at a particular service. A third goes to people willing to provide biological samples for a research project. The same person could receive all three, only one or none. The location listed on the paper tells you less about representation than the rule used to send the invitations.
A national registry is especially easy to misunderstand. National coverage describes geographical reach or the records a system collects. It may be excellent for studying people with a recorded diagnosis across that system. Whether it can also estimate prevalence depends on additional information, including membership in the population at risk, coverage of relevant care settings and the reliability of the recorded case definition.
Think of a clinic that changes its referral arrangements. One year a patient needs a specialist referral. The following year primary care can refer directly. The patient population may change even if the community outside the clinic stays much the same. This hypothetical example gives a concrete meaning to selection. No individual has to give an inaccurate answer for the resulting patient mix to change.
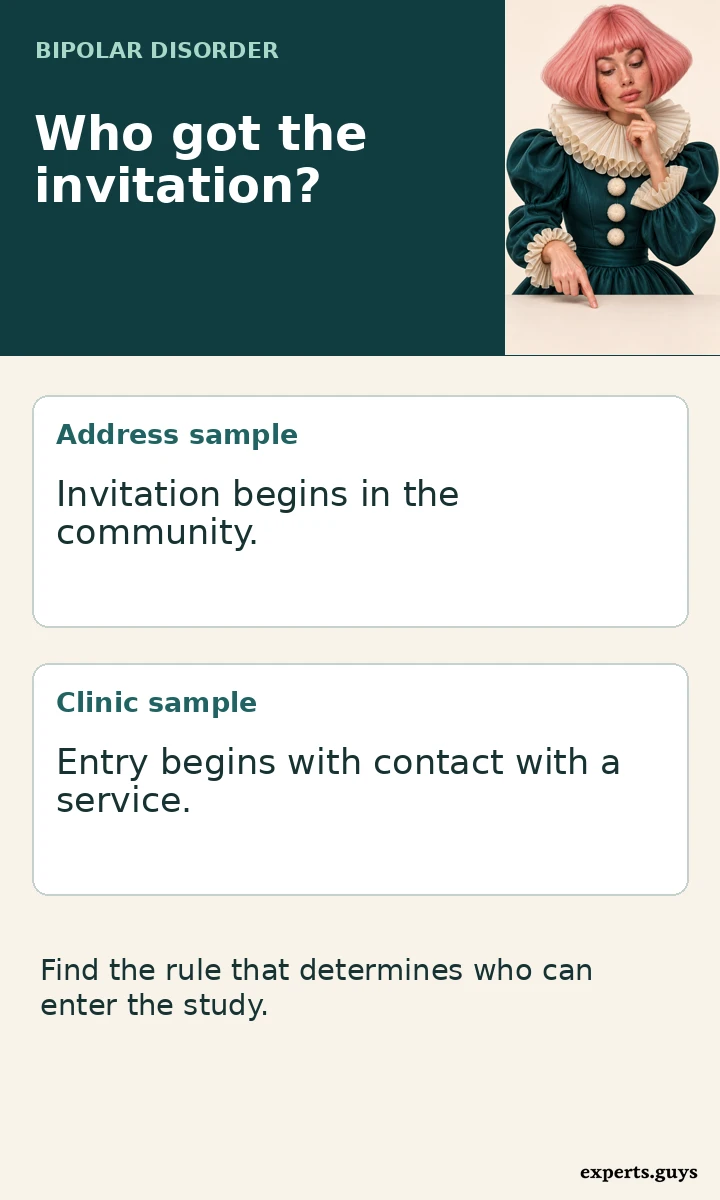
Access can operate at several points. People have to notice a reason to seek help, have a service they can reach, be assessed, and sometimes agree to further research. Different barriers may operate in different places, or at different stages for the same person. The ten-study review did not observe every stage for every eligible resident. Its percentages cannot apportion a gap among recognition, referral, participation and other possibilities.
For somebody whose own route to diagnosis took years, that distinction can matter personally. A registry entry may carry one exact date even when the experience leading to it spans several years. A late entry tells a researcher when a particular system recorded the diagnosis. It does not, on its own, tell a family when the condition began or how many opportunities for earlier recognition there were.
Why a positive screen belongs in a separate column
A screening questionnaire selects people whose answers cross a chosen threshold. A diagnostic interview applies a more detailed set of criteria. An administrative code records what entered a health system. Each can support valuable research. If a headline quietly exchanges one measure for another, a reader can leave with a much stronger conclusion than the researchers reached.
For example, England’s Adult Psychiatric Morbidity Survey reported that 2.1% of women and 1.7% of men screened positive in 2023–24. The report describes the proportions as similar. Saying that 2.1% of women received a bipolar diagnosis would change the outcome being reported. Using the result to rank England against older US diagnostic-interview estimates would also change the question.
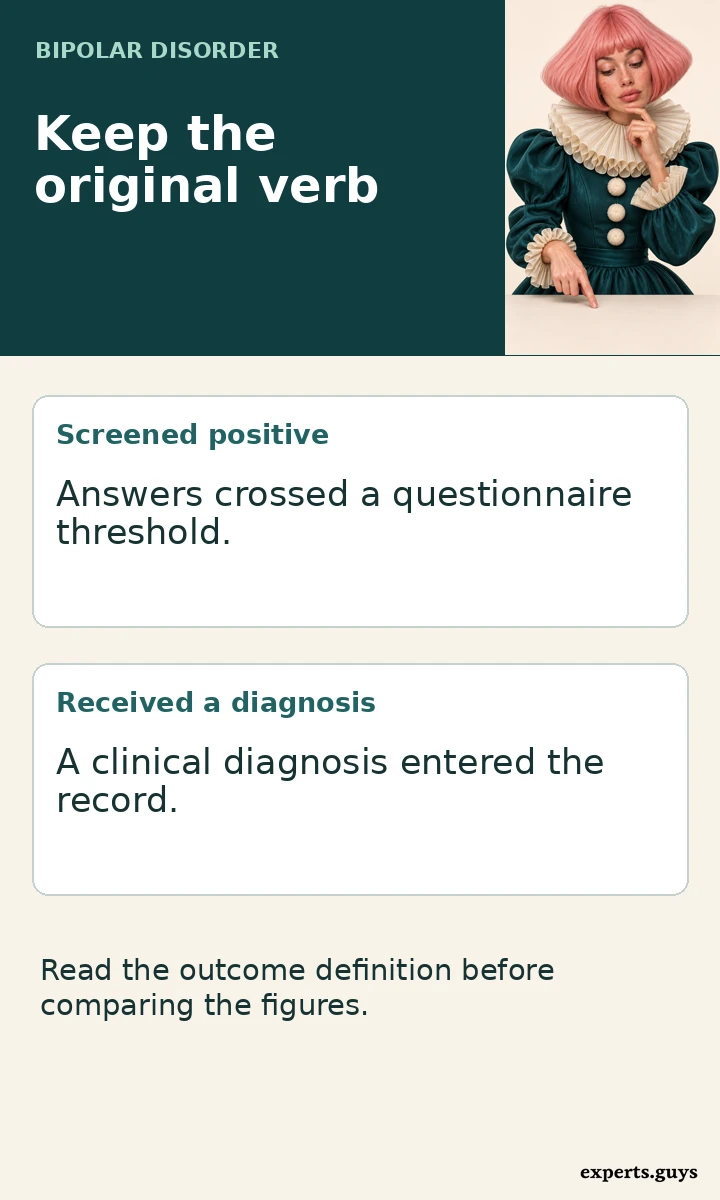
Notice how much meaning is carried by a verb. “Screened positive,” “met interview criteria,” “received a diagnosis” and “joined a study” can all end with a percentage sign. A faithful headline keeps the original verb. If the verb has disappeared, the first place to look is the methods section, where the investigators explain the threshold, interview or record they used.
- Locate the group invited to participate.
- Read the exact outcome beside the percentage.
- Check who supplied the denominator.
A screening result also depends on the people invited to complete the questionnaire and on who finished it. A carefully designed household survey can address some sources of imbalance through sampling and weighting. Weighting gives some responses more influence so that the analysed group better reflects the population the survey was designed to represent. It cannot change a screening questionnaire into a clinical assessment.
What changes when bipolar I and II are separated?
A study that includes several bipolar subtypes reports a total shaped by the size and composition of each subgroup. A sample drawn from a service with many bipolar II referrals may look different from a programme limited to bipolar I. Before comparing a number from one paper with a number from another, check which patients could enter each one. The label “bipolar” alone leaves that question open.
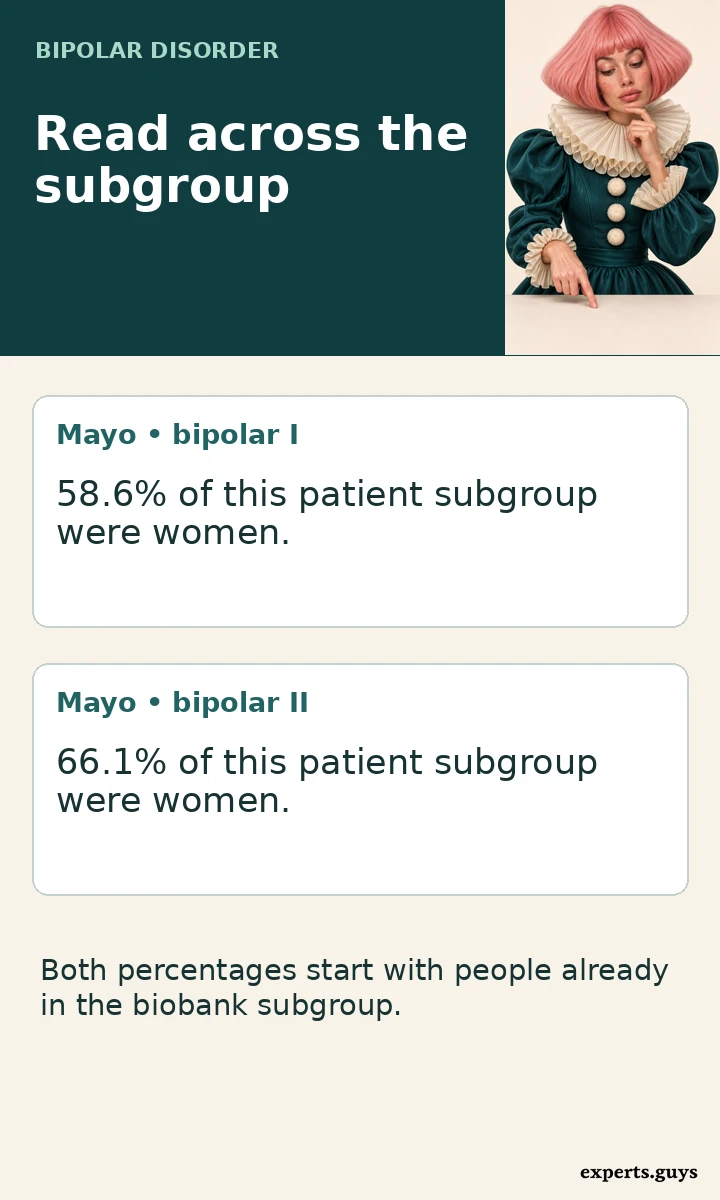
The review provides a useful detail here. Women formed a majority even in the study restricted to bipolar I. In the Mayo Clinic Biobank data described by the review, women accounted for 58.6% of the bipolar I subgroup and 66.1% of the bipolar II subgroup. Those figures make one simple explanation insufficient: including bipolar II was not necessary for a female majority to appear in a patient sample.
The percentages also illustrate a subtle trap. “Women accounted for 66.1% of the bipolar II subgroup” does not tell a woman with a bipolar diagnosis that she has a 66.1% chance of having bipolar II. To answer that second question in the biobank, the denominator would be all participating women with a bipolar diagnosis, and the numerator would be the women in the bipolar II subgroup. Applying either percentage outside the biobank would require further evidence.
Imagine two imaginary research sites. At both sites women make up half of a small subgroup and two-thirds of a second subgroup. One site recruits mainly from the first subgroup, the other mainly from the second. Their overall percentages will differ even though the within-subgroup patterns match. The mixture matters. A percentage for an entire sample does not reveal how much each subgroup contributed to it.
For a reader interested in a particular diagnosis, the most relevant row may therefore sit below the headline total. Some papers provide the needed cross-tabulation, a table showing two characteristics together. Others list the number of women and the number with bipolar II in separate rows. The second format leaves the overlap unknown. Knowing both totals is insufficient to reconstruct who falls in both groups.
Can ten studies establish a change over time?
The word “become” makes a historical claim. It requires evidence about an earlier state, a later state and the comparability of the two measurements. A collection of studies published in one decade can reveal a recurring pattern. Publication order alone cannot turn independently assembled patient groups into a history of changes in the general population.
One paper in the review used US treatment programme data collected from 1999 to 2005. Another used UK primary care records spanning 2000 to 2014. The observation periods overlap, the countries differ, and the routes into the data differ. Putting the papers next to one another in publication order would create a tidy timeline on the page while concealing what happened on the ground.
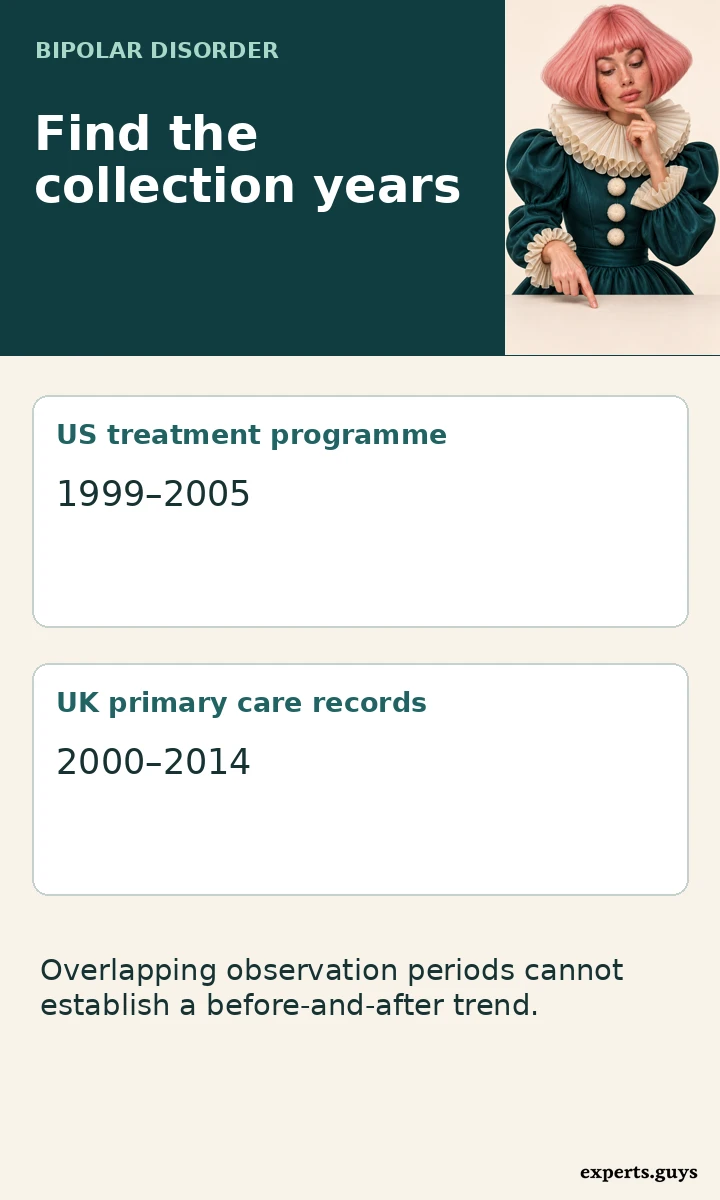
A stronger trend comparison would repeat comparable assessments in the same target population at more than one point in time. It would identify the years of data collection, the age range, who was eligible, how cases were defined and what uncertainty surrounds each estimate. If the survey changed its interview or expanded its coverage midway, the researchers would need to explain how they handled that break.
Even a genuine rise in recorded diagnoses can mean several things. A service might reach patients it previously missed, a clinician might document existing illness more consistently, or the underlying frequency might change. More than one process could occur at once. To learn which explanation fits, a researcher needs observations capable of distinguishing them. A count of newly entered records by itself cannot establish a change in the occurrence of new illness.
This matters when two apparently similar words appear in a headline. Prevalence concerns people living with a condition over a specified period or at a specified point. Incidence concerns new cases over time among people at risk. A newly recorded diagnosis is an administrative event. Treating all three as interchangeable can make improved access look like a sudden change in biology.
How much does the larger number tell us?
Large samples help researchers describe the people they actually observed. A research team with thousands of records can often examine subgroups that would be too small in a single clinic. Precision and reach are different strengths, however. A very precise description of one recruitment route can leave major uncertainty about people outside that route.
In the English screening survey, the reported 95% confidence intervals were 1.5%–2.8% for women and 1.2%–2.5% for men. Both estimates have uncertainty. The survey authors describe the proportions as similar. Reading the decimal values alone and declaring a winner discards part of the result. Equally, similar estimates do not prove that the underlying rates are identical to the last decimal place.
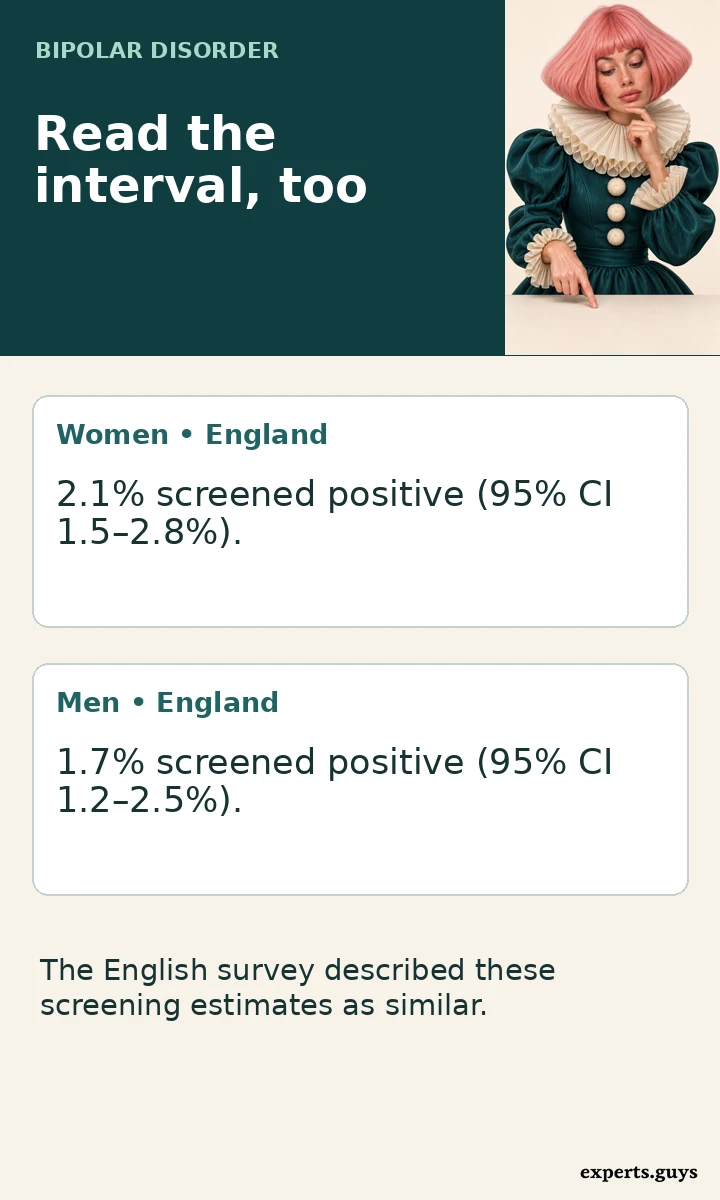
A confidence interval expresses uncertainty under the assumptions of the analysis. It does not put a numerical boundary around every possible source of error. If an entire group could not take part, drawing a neat interval around the responses received does not bring those missing experiences back into the sample. The invitation, the outcome definition and the precision of the estimate deserve separate attention.
It is tempting to settle an apparent disagreement by choosing whichever study has the largest participant count. Instead consider which study could answer the question in the first place. For the experience of patients receiving a particular treatment, a treatment programme may have the more relevant information. For the proportion of adults in a country who met interview criteria, a suitably designed population survey has a different advantage. Counting more people cannot repair a mismatch between a question and a study design.
What the categories can tell a reader
Study tables use terms such as female and male, women and men, sex and gender. Their meanings depend on the question participants were asked or the field researchers obtained from a record. A two-category table rarely tells a reader, by itself, whether the underlying field recorded sex at birth, legal sex, self-described gender or something else. Use the authors’ category names when reporting a specific result.
This matters for people who do not see themselves represented in a table. A missing category tells us about the report’s limits. It supplies no estimate for that group and no basis for assigning its members the rate of another group. Even when a survey collected further categories, small numbers or privacy rules may restrict what it can publish. If the report gives no explanation, the reason remains unknown.
Labels also matter when a source moves between settings. A hospital may use the field available in its patient record. A survey could invite respondents to describe themselves. If a reviewer combines publications with different methods, the broad category headings can look consistent after the details have been compressed. A conclusion about a biological mechanism or the effects of gendered experience requires more evidence than a tabulated difference.
What changes for someone reading about their own health?
Someone may arrive here after hearing that a relative’s diagnosis is unusual “for a man,” or that a woman’s depression must be bipolar because women fill more places in a clinic study. Neither inference follows from the evidence. A group percentage carries no individual history. It cannot establish what episodes a person has experienced, what another explanation might be, or whether a diagnosis fits.
If your question concerns the difference between diagnostic categories, the explanation of unipolar and bipolar depression addresses that directly. If you want a broader introduction before reading research tables, start with the bipolar disorder overview. A population statistic serves a narrower purpose. It helps interpret how often something was observed and among whom.
A more constructive use of the review is to ask whose experience informs a particular finding. A patient deciding whether a study speaks to their situation might care whether it enrolled people in routine primary care or people attending a specialist service. They might look for their age range, subtype or treatment setting. Even a close demographic match leaves room for individual variation. Representation is one piece of relevance.
For a family, a small change in wording can ease an unnecessary burden. “More women took part in those studies” is a statement about participation. It leaves the person in front of you free to describe their own experience. “This is a women’s disorder” assigns a meaning to the diagnosis that the data cannot sustain. The difference matters even when nobody in the conversation remembers the precise percentages.
When a perfectly accurate number makes a poor headline
Consider a hypothetical local news report announcing that women account for most of a hospital’s bipolar admissions. The first question is whether the hospital counted admissions or people. One patient admitted three times can contribute three admissions. If the report is about bed use, counting each stay is appropriate. If the headline describes the number of people living with bipolar disorder nearby, the unit has changed halfway through the story.
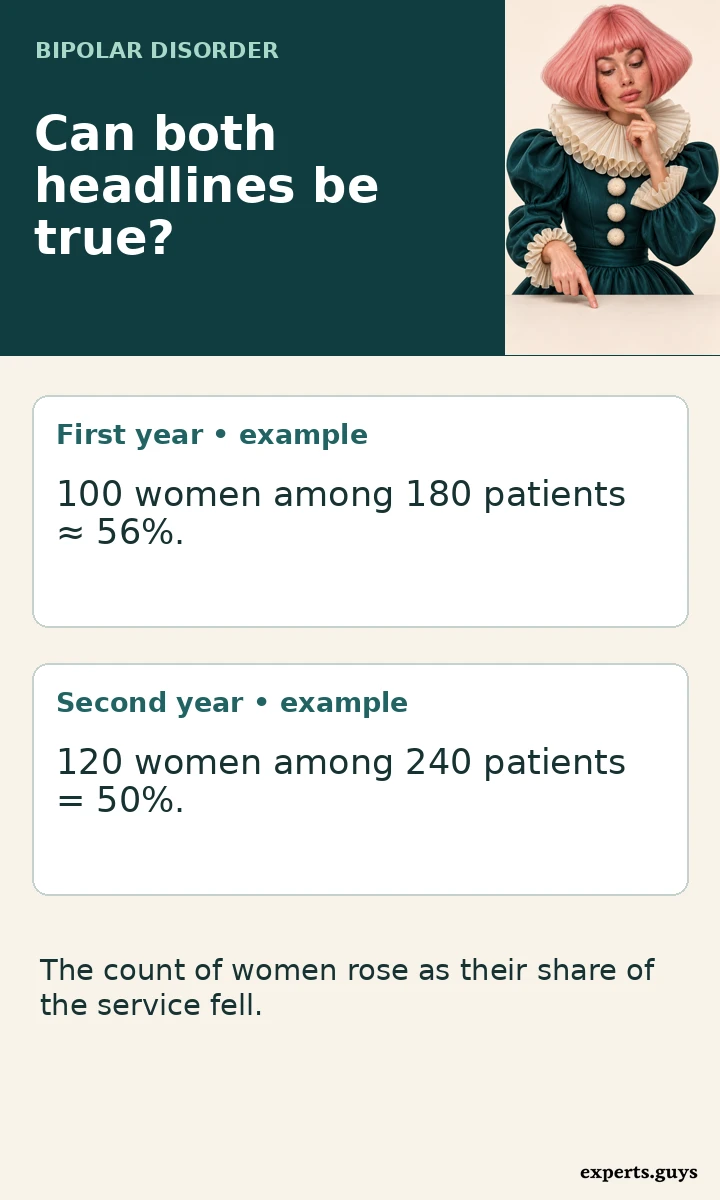
A second example comes from a hypothetical service expanding its catchment area. Last year it enrolled 100 women and 80 men. This year it enrolled 120 women and 120 men. The number of women rose while their share of enrolments fell, from about 56% to 50%. A headline about rising numbers and another about a falling share could both describe the same service. Neither calculation tells us how the population prevalence changed. Even the direction of a change depends on the quantity being discussed.
One further distinction is easy to miss in a review of several papers. The middle of a reported range is not automatically a combined estimate. If two imaginary studies report 55% and 65% women, their midpoint is 60%. But if the first study enrolled 9,000 patients and the second enrolled 1,000, the combined share would be 56%. Combining counts answers a particular question about the assembled records. Giving every study equal weight answers a different question about the studies. Neither method makes the sample representative by arithmetic alone.
This is why quoting the range from the large-sample review is informative. It preserves the variation across studies and lets readers see that a female majority appeared across several settings. Guessing one global percentage from the ends of that range would erase the sizes of the contributing studies, the differences in recruitment, and the absence of eligible community members who never entered the research.
What evidence would change the answer?
Suppose a future survey found a sizeable difference between women and men using the same interview in both groups. That would be evidence about those groups in that survey’s population and period. A similar result in a second independently sampled population would tell us more about how widely the finding might apply. To establish that the difference had grown, researchers would still need a comparable earlier measurement. Each additional claim needs a corresponding piece of evidence.
Age illustrates the value of that extra care. Imagine a survey that includes many older adults in one group and mostly younger adults in another. If prevalence differs by age, the overall estimates partly reflect the age composition. Researchers can compare people within age bands or calculate estimates under a common age distribution. Such an adjustment answers what the comparison would look like with a shared age mix. It does not correct every difference between two groups.
The practical question can also be local. A health service might want to know whether men with an existing diagnosis reach follow-up appointments as readily as women. The relevant denominator would be patients eligible for follow-up in each group. Counting everyone in the city would dilute the service question. Counting only those who came back would hide the very patients the service wants to understand. The right denominator depends on the decision the information is supposed to support.
There is a similar opportunity in research participation. A team interested in representation could compare eligible patients, people invited, people who consented and people who completed follow-up. A shift between two adjacent groups would identify where representation changed and where to ask more detailed questions. A final participant table alone cannot reconstruct those steps. This is one reason a study can generate a good follow-up question even when it cannot settle the question in its title.
Frequently asked questions
Does a female majority in every study make the conclusion certain?
It strengthens confidence in a narrow observation: women outnumbered men in the selected studies. If different studies share a route through diagnosis or treatment, they can also share a source of selection. Repetition across those routes does not tell us how many people outside them would meet the same case definition. That calls for a population-based comparison.
Does 65% mean that 65 in 100 women have bipolar disorder?
The 65 in that figure are women among 100 participants who already belonged to a bipolar disorder sample. To estimate prevalence among women, the starting group would instead include women with and without bipolar disorder. A percentage is interpretable only when the group represented by 100 is clear.
Why can a national study and a worldwide overview give different impressions?
A national study may describe patients recorded by one healthcare system. A worldwide overview may synthesise population evidence across settings. The geographical labels sound comparable, but the data may answer different questions. It is possible to have excellent national coverage of a service and still lack information about residents who never use it.
Is the difference between 2.8% and 2.9% clinically meaningful for one person?
Those percentages describe groups in an older US survey. The difference is one tenth of a percentage point, equivalent to one person per thousand on the scale of the estimates. It gives no information about an individual person’s episodes, their impact or the explanation that best fits their history.
Can these studies explain why women receive more diagnoses?
They can show where a difference appears. Identifying why would require information about people before diagnosis as well as after it. For example, data on who was eligible for assessment and who actually received it could illuminate one part of the process. The final ratio of diagnosed patients cannot distinguish that explanation from other routes to the same result.
Do these results apply to nonbinary people?
The reported female and male percentages do not provide a separate estimate for nonbinary people. To answer that question, a study would need an appropriate measure of gender, a sampling design that includes the population of interest, and enough participants to report a meaningful estimate while protecting privacy.
What wording can I use when sharing the finding?
“Women made up the majority of participants in ten large bipolar disorder studies” preserves both the observation and its scope. If the discussion concerns how common the condition is, add that population evidence describes broadly similar prevalence among women and men. Keeping the two sentences separate makes it easier to see which source answers which question.
What the evidence supports
Women’s majority in the ten studies tells us whose data helped shape bipolar disorder research. Population surveys start with a different group and support a more measured answer about overall prevalence. When a figure appears in a headline, the most revealing words may be the ones that come immediately after it: among whom, measured how, and during which years?