
Why Most People Fail at Bitcoin Chart Analysis
Most people do not struggle with Bitcoin charts because they are too complex. They struggle because they are looking at them incorrectly.
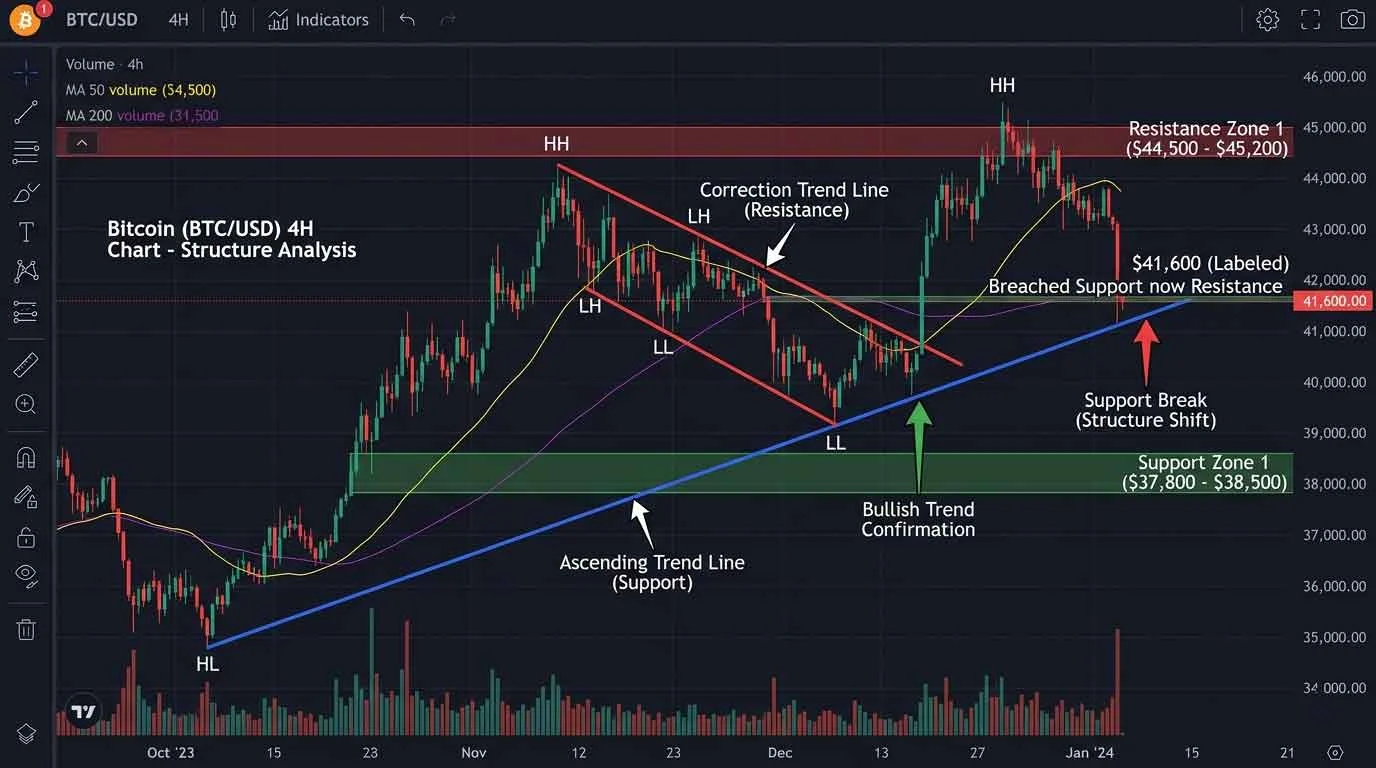
A Bitcoin chart is not just a price graph. It is a compressed visual system that represents behavior, reaction, and repetition over time.
When beginners open a chart, they see:
- Lines moving up and down
- Candles forming patterns
- Indicators they do not understand
The problem is not the chart. The problem is the interpretation layer.
Without a structured way to read the chart, every movement appears random. Randomness removes confidence. Without confidence, analysis becomes guesswork.
This is why many people either abandon chart reading or rely entirely on external opinions.
The failure is not technical. It is structural.
The Hidden Mechanism Behind Chart Understanding
Understanding a Bitcoin chart depends on three core mechanisms working together.
Markets do not move randomly – they repeat behavior in different forms.
1 – Visual Structure Recognition
The brain processes charts as visual patterns, not numerical data. This is the same underlying skill required when people learn to analyse visual patterns effectively, where structure and contrast guide attention and understanding.
Price movements form:
- Trends
- Ranges
- Reversals
These are not abstract concepts. They are recurring visual structures.
When a user cannot recognize these structures, the chart appears chaotic.
When structure is recognized, the same chart becomes readable.
This is the same underlying principle used when people learn to recognize visual patterns clearly, where repetition and contrast train the brain to identify meaningful signals.
2 – Context Layer
A chart does not exist in isolation.
Each movement must be understood relative to:
- Previous price behavior
- Key levels
- Market reaction zones
Without context, a price move has no meaning.
For example:
- A rise in price could signal strength
- Or it could signal a temporary reaction before a decline
Context determines interpretation.
3 – Time Compression
Charts compress time into a visual format.
A single screen may represent:
- Minutes
- Hours
- Days
- Months
This compression creates an illusion of continuity.
In reality, each candle represents a completed cycle of activity.
Understanding this changes how movements are interpreted. It shifts the perspective from continuous motion to discrete events.
Why Free Tools Are More Than Enough
A common misconception is that advanced tools are required for accurate analysis.
This is incorrect.
The effectiveness of analysis does not depend on tool complexity. It depends on how the chart is read.
Free platforms already provide:
- Real-time price data
- Multiple timeframes
- Drawing tools
- Basic indicators
The limitation is not the tool. It is the user’s interpretation model.
A simple, well-understood setup consistently outperforms a complex, poorly understood one.
The Core Mistake – Looking for Signals Instead of Structure
Many beginners focus on:
- Indicators
- Signals
- Entry points
This approach skips the foundational layer.
Without structure, signals are meaningless.
A signal only has value when it aligns with:
- Trend direction
- Key levels
- Market behavior
Focusing on signals without structure creates inconsistency.
The Correct Sequence – Structure Before Interpretation
A reliable approach follows this sequence:
Step 1 – Identify Structure
Determine whether the market is:
- Trending
- Ranging
- Transitioning
This defines the environment.
Step 2 – Define Key Levels
Mark areas where price reacts:
- Support
- Resistance
- Consolidation zones
These levels act as reference points.
Step 3 – Observe Behavior
Watch how price interacts with these levels.
Behavior provides information about:
- Strength
- Weakness
- Continuation
Step 4 – Interpret, Not Predict
Interpretation focuses on what is happening.
Prediction attempts to guess what will happen.
The first builds understanding. The second introduces risk without structure.
Why Watching the Chart Is Different From Analysing It
Watching a chart is passive.
Analysing a chart is structured.
Watching involves:
- Observing movement
- Reacting emotionally
Analysing involves:
- Identifying structure
- Placing context
- Interpreting behavior
The difference is not time spent. It is method applied.
Why Most People Use the Wrong Chart Setup
Most beginners do not fail because they lack tools. They fail because they use too many tools without understanding their purpose.
A typical beginner chart looks like this:
- Multiple indicators stacked on top of each other
- Conflicting signals
- Overlapping lines and colors
Instead of improving clarity, the chart becomes harder to read.
The goal of a chart setup is not to add information. It is to remove noise and highlight structure.
A clean chart reveals behavior. A cluttered chart hides it.
The Only Free Tool You Actually Need
For beginner and intermediate analysis, one platform is sufficient:
Core Platform – TradingView
This platform provides:
- Real-time Bitcoin charts
- Multiple timeframes
- Drawing tools
- Basic indicators
- Clean visual interface
The strength of the platform is not its features. It is its flexibility.
A user can build a simple, structure-focused environment without additional tools.
The Correct Chart Setup (Minimal System)
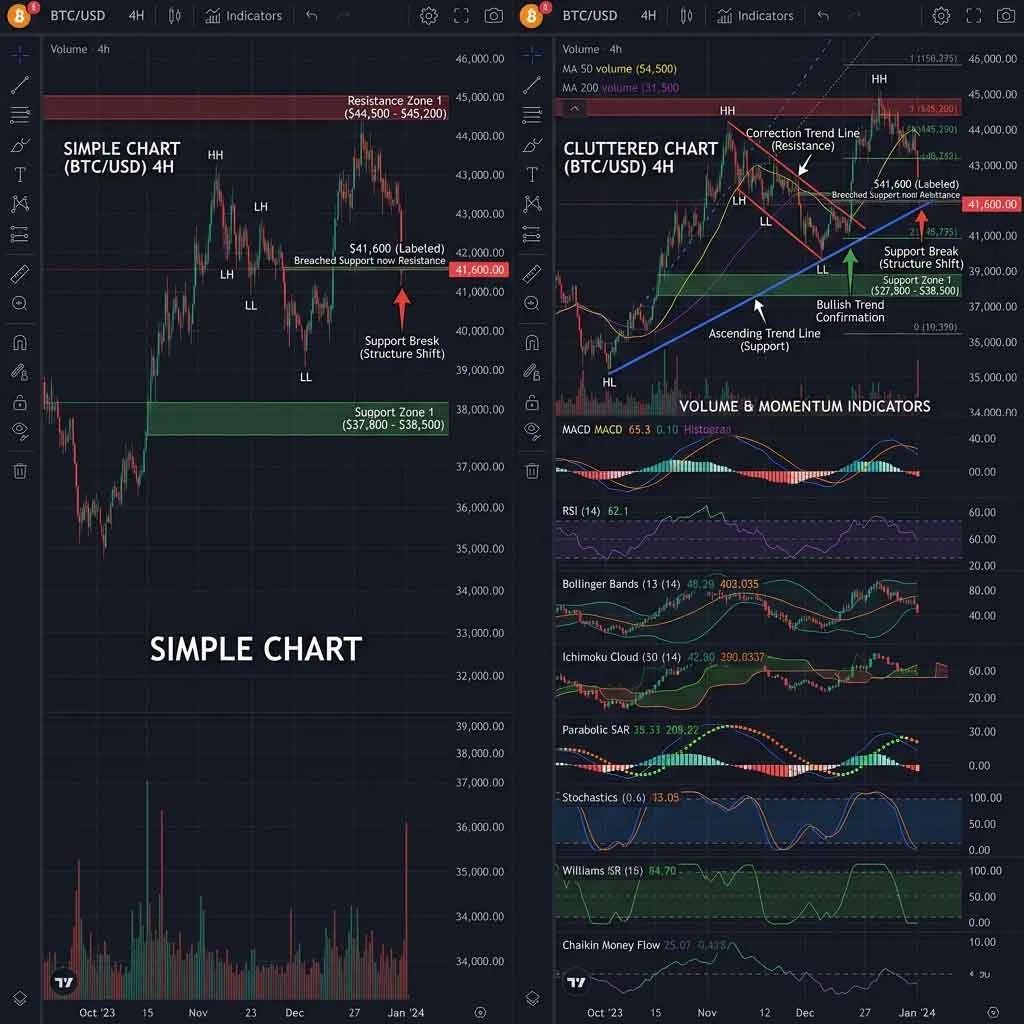
A working setup should include only what supports structure recognition.
Step 1 – Clean Candlestick Chart
Use:
- Standard candlestick view
- Dark or neutral background
Remove:
- All unnecessary indicators
- Default overlays that are not understood
Candlesticks already contain sufficient information: open, close, high, and low. This is the raw data of market behavior and forms the foundation for anyone learning to understand candlestick patterns clearly before adding complexity:
- Open
- Close
- High
- Low
This is the raw data of market behavior.
Step 2 – Timeframe Selection
Use three key timeframes:
- Higher timeframe (4H or Daily) – defines overall structure
- Mid timeframe (1H) – shows current movement
- Lower timeframe (15m) – refines observation
The purpose is not to analyze all at once, but to understand context.
Higher timeframe defines direction. Lower timeframe shows detail.
Step 3 – Draw Key Levels
Add horizontal lines for:
- Support
- Resistance
- Previous reaction zones
These lines create a framework.
They act as reference points where behavior can be observed.
Without these levels, price movement lacks context.
Step 4 – Optional Indicator (Limit to One)
If an indicator is used, it should serve a clear purpose.
A simple moving average can help identify:
- Direction
- Trend consistency
However, it is optional.
Indicators should support structure, not replace it.
Why Simplicity Outperforms Complexity
A simple chart allows the brain to:
- Identify patterns faster
- Track movement clearly
- Maintain focus
Complex charts introduce conflicting signals.
When multiple indicators disagree, the user must decide which one to trust. This increases cognitive load.
Higher cognitive load reduces decision clarity.
Clarity is the goal, not quantity of data.
Common Tool Mistakes That Reduce Accuracy
Mistake 1 – Indicator Stacking
Using multiple indicators creates redundancy.
Many indicators are derived from the same price data. They do not add new information. They repackage existing information.
Mistake 2 – Changing Settings Frequently
Constantly adjusting indicators prevents consistency.
Without consistency, patterns cannot be recognized.
Mistake 3 – Ignoring Timeframe Context
Looking at a single timeframe removes perspective.
A movement that appears significant on a lower timeframe may be insignificant on a higher one.
Mistake 4 – Overfocusing on Precision
Attempting to identify exact entry points shifts attention away from structure.
Structure defines probability. Precision attempts to eliminate uncertainty.
Why Most People Look at the Wrong Things First
When beginners open a Bitcoin chart, their attention usually goes to movement instead of structure.
They watch:
- Price going up or down
- Large candles forming
- Sudden spikes or drops
This creates an emotional response instead of a structured interpretation.
The correct approach does not start with movement. It starts with environment.
Before analysing any chart, the first question is not “where is price going?” but:
“What type of environment is this?”
Without answering this, every observation becomes unstable.
The 4-Step Chart Reading System (Repeatable Framework)
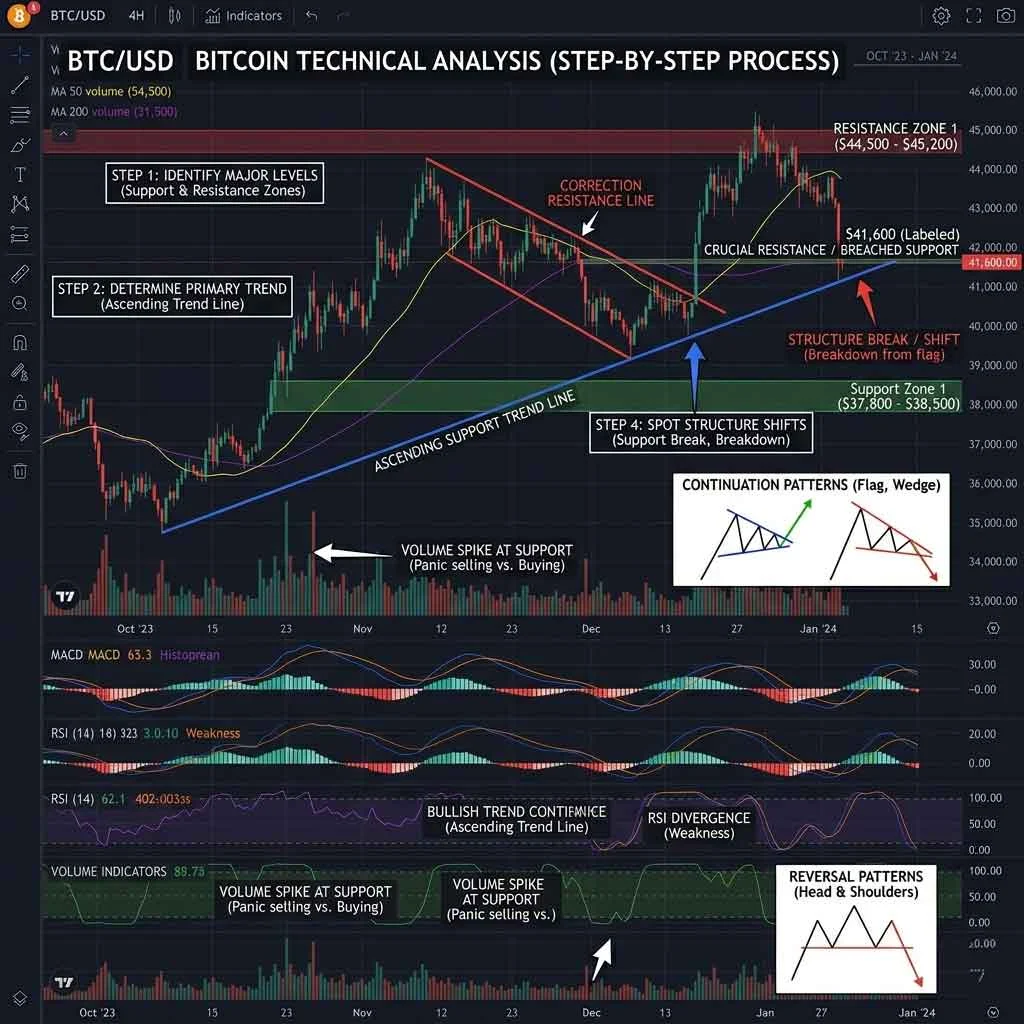
This system transforms chart observation into structured analysis. The same principle applies when people build structured observation systems, where clarity comes from process rather than randomness.
Step 1 – Identify Market Structure
Determine whether the market is:
- Trending upward
- Trending downward
- Moving sideways (range)
This is the foundation.
A trend shows directional consistency. A range shows balance between buyers and sellers.
Misidentifying structure leads to incorrect interpretation.
Step 2 – Mark Key Levels
Once structure is identified, define the areas where price reacts.
Mark:
- Support levels (where price stops falling)
- Resistance levels (where price stops rising)
- Previous consolidation zones
These levels act as reference points.
They are not exact lines. They are zones where behavior changes.
Step 3 – Observe Price Behavior at Levels
Price does not move randomly at key levels.
It reacts.
Observation should focus on:
- Whether price rejects the level
- Whether price breaks through
- Whether price consolidates
This behavior provides information about:
- Strength
- Weakness
- Continuation potential
Step 4 – Align Across Timeframes
Interpretation becomes stronger when multiple timeframes align.
For example:
- Higher timeframe shows an upward trend
- Lower timeframe shows a pullback
This combination creates context.
Without alignment, signals become isolated and unreliable.
How to Read Trends Without Overthinking
A trend is not defined by a single movement. It is defined by consistency.
Uptrend
- Higher highs
- Higher lows
Downtrend
- Lower highs
- Lower lows
Range
- Price moves between two boundaries
The mistake is trying to identify trends too early.
Trends become visible through repetition, not prediction.
How to Identify Strong vs Weak Levels
Not all levels are equal.
Strong Levels
- Multiple reactions
- Clear rejection or breakout
- Visible on higher timeframes
Weak Levels
- Few interactions
- Inconsistent reactions
- Only visible on lower timeframes
Strength is determined by repetition.
The more times a level influences price, the more relevant it becomes.
Why Most Interpretations Go Wrong
Error 1 – Ignoring Structure
Jumping directly to signals without understanding structure creates inconsistency.
Error 2 – Overreacting to Single Candles
A single candle does not define direction.
It must be interpreted within context.
Error 3 – Misreading Breakouts
Not all breakouts are valid.
Some are temporary movements before reversal.
Error 4 – Lack of Timeframe Alignment
Conflicting signals across timeframes create confusion.
Alignment reduces uncertainty.
Visual Pattern Recognition – The Real Skill Behind Analysis
Chart reading is not about prediction. It is about recognition.
The brain identifies:
- Repetition
- Contrast
- Structure
Over time, patterns become easier to recognize.
This is not intuition. It is trained observation.
Expertise Reinforcement – Limits of Chart Analysis
Chart analysis has inherent limitations.
Limitation 1 – Uncertainty
Markets are influenced by multiple factors beyond visible data.
Charts show behavior, not cause.
Limitation 2 – Subjectivity
Different users may interpret the same chart differently.
Interpretation depends on experience and consistency.
Limitation 3 – Timeframe Dependency
A valid interpretation on one timeframe may not hold on another.
Understanding context reduces misinterpretation but does not eliminate variability.
Why Most People Never Improve at Chart Analysis
Most users repeat the same behavior without realizing it.
They:
- Look at charts daily
- React to movements
- Try different indicators
- Change strategies frequently
This creates activity, but not improvement.
Improvement in chart analysis does not come from exposure alone. It comes from structured repetition.
Without structure, experience becomes noise.
The Skill Development Model for Chart Reading
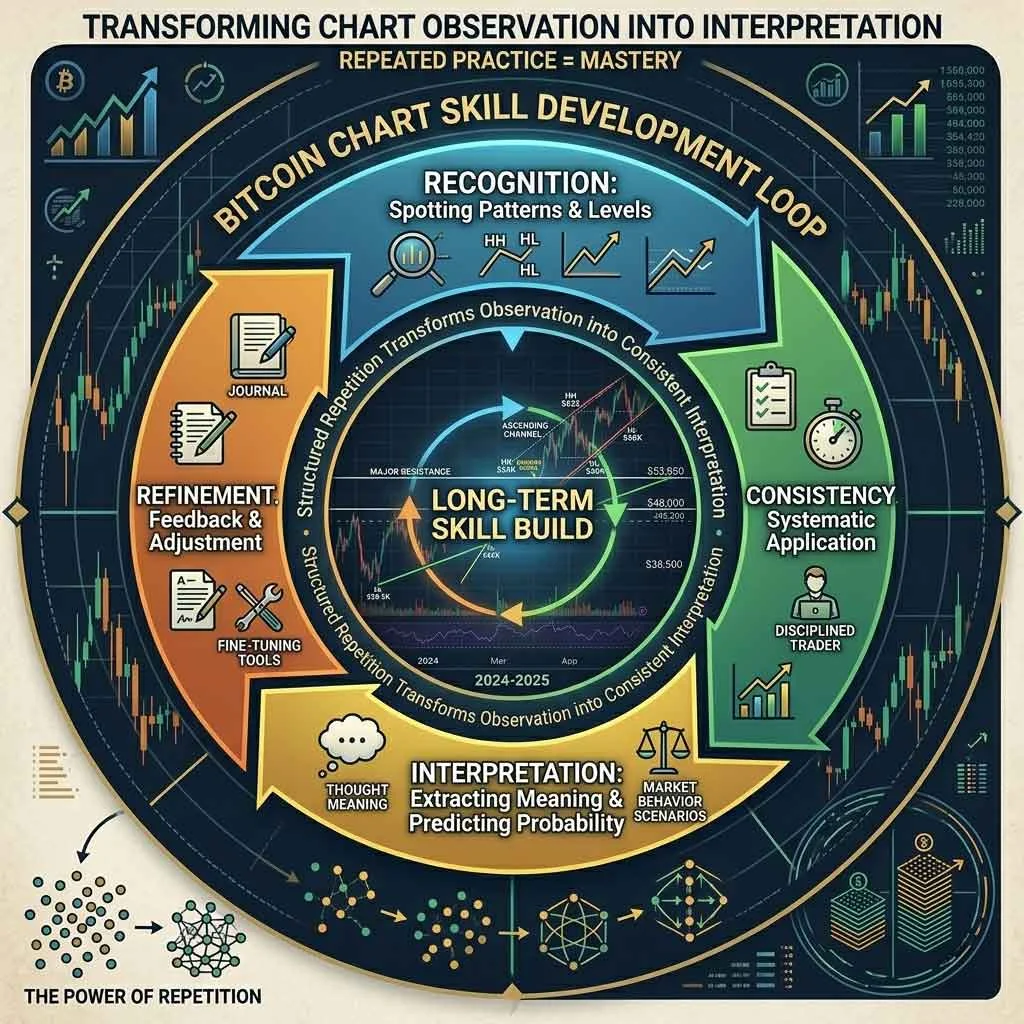
Long-term improvement follows a layered model.
Layer 1 – Recognition
At this stage, the user learns to identify:
- Trends
- Ranges
- Key levels
Recognition is visual. It does not require prediction.
Layer 2 – Consistency
The user applies the same method repeatedly:
- Same timeframes
- Same level-marking process
- Same observation sequence
Consistency builds pattern familiarity. This is the same principle used when people create structured learning environments, where repeated exposure within a clear system leads to deeper understanding.
Layer 3 – Interpretation
The user begins to understand behavior:
- How price reacts at levels
- How trends continue or weaken
- How structure evolves over time
Interpretation emerges from repeated observation.
Layer 4 – Refinement
The user filters noise:
- Ignores irrelevant movements
- Focuses on high-quality structures
- Reduces unnecessary tools
Refinement increases clarity.
The Psychological Traps That Disrupt Analysis
Chart analysis is not only technical. It is behavioral.
Trap 1 – Overreaction to Movement
Large price movements trigger emotional responses.
This leads to:
- Impulsive decisions
- Loss of structure
- Inconsistent interpretation
Trap 2 – Constant Strategy Switching
Changing methods frequently prevents pattern recognition.
Without repetition, the brain cannot form reliable connections.
Trap 3 – Seeking Certainty
Markets do not provide certainty.
Attempting to eliminate uncertainty leads to overcomplication.
Trap 4 – Confirmation Bias
Users look for information that supports their expectation.
This distorts interpretation.
How to Build Consistency Without Overcomplication
Consistency is built through limitation.
Rule 1 – Fixed Chart Setup
Use the same:
- Timeframes
- Drawing method
- Minimal indicators
This creates a stable environment.
Rule 2 – Repeat the Same Process
Follow the same sequence:
- Identify structure
- Mark levels
- Observe behavior
- Interpret
Repetition builds reliability.
Rule 3 – Limit Information Intake
Too much information reduces clarity.
Focus on:
- Price behavior
- Key levels
- Structure
Ignore unnecessary signals.
Why Prediction Is Not the Goal
Many beginners approach chart analysis as a prediction tool.
This creates unrealistic expectations.
Chart analysis is better understood as:
- A way to interpret current behavior
- A way to identify structure
- A way to reduce randomness
Prediction attempts to define the future.
Interpretation focuses on understanding the present.
The second is more stable and consistent.
Integrating the Full System
A complete chart analysis system includes:
1 – Clean Tool Setup
A simple chart with minimal indicators.
2 – Structured Reading Process
A repeatable 4-step system:
- Structure
- Levels
- Behavior
- Interpretation
3 – Consistent Practice
Repeated use of the same method.
4 – Progressive Refinement
Reducing noise and improving clarity over time.
Expertise Reinforcement – What This System Does Not Do
This system does not:
- Guarantee outcomes
- Remove uncertainty
- Replace external factors
It provides structure.
Structure improves clarity, but it does not eliminate variability.
FAQs
What is the best free tool for Bitcoin chart analysis?
TradingView is one of the most widely used free platforms. It provides real-time data, multiple timeframes, and drawing tools needed for structured chart analysis.
Do I need indicators to analyse Bitcoin charts?
No. A clean chart using candlesticks and key levels is sufficient. Indicators can support analysis but should not replace structure recognition.
Why do beginners struggle with chart reading?
Beginners often focus on signals and indicators instead of structure. Without understanding trends and key levels, charts appear random and difficult to interpret.
Is chart analysis about predicting price?
No. Chart analysis is primarily about interpreting current market structure and behavior, not predicting exact future movements.