


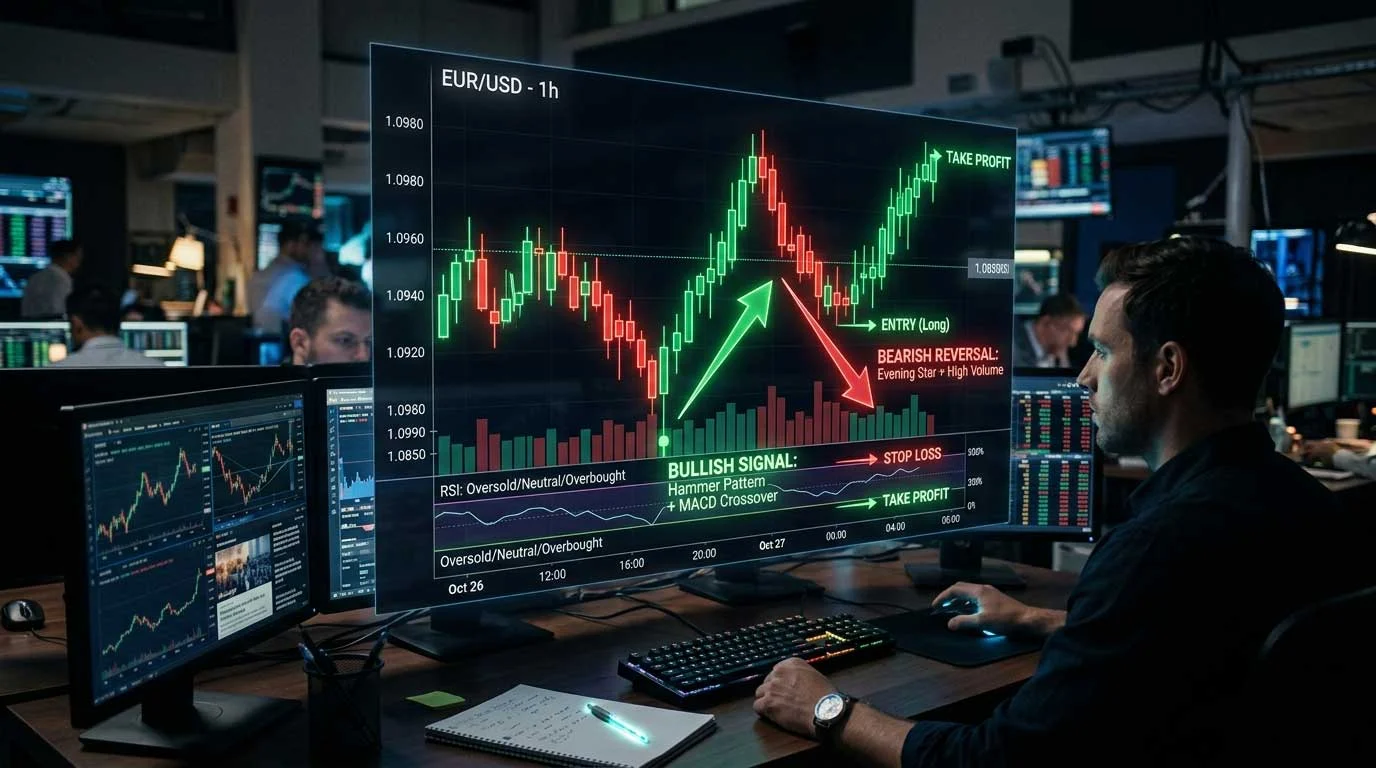
What Candlestick Patterns Actually Represent
Most explanations of candlestick patterns begin with names and shapes. They show a hammer, a doji, or an engulfing pattern, and then attach a simple label such as bullish or bearish. This surface-level approach creates recognition, but it does not create understanding. Traders who rely only on pattern names often struggle because the same pattern can lead to different outcomes depending on context.
Candlestick patterns are not signals by themselves. They are compressed representations of market behavior over a specific period of time. Each candle reflects a sequence of decisions made by buyers and sellers. The opening price shows where agreement began. The closing price shows where pressure ended. The high and low represent the extremes of that negotiation.
When these elements are combined, a candle becomes a behavioral snapshot. A long lower wick suggests rejection of lower prices. A strong close near the high suggests sustained buying pressure. A small body with long wicks indicates uncertainty and conflict. These are not abstract shapes. They are evidence of how participants interacted with price.
This is why memorizing patterns without understanding the mechanism leads to inconsistent results. A hammer in a strong downtrend does not mean the same thing as a hammer in a sideways market. The shape may be identical, but the underlying pressure dynamics are different.
To understand candlestick patterns correctly, the focus must shift from identification to interpretation. Instead of asking “What pattern is this,” the better question becomes “What behavior created this candle.” This shift changes candlestick patterns from static labels into dynamic signals that can be evaluated in real trading conditions.
The Core Mechanism Behind Price Movement
Price does not move because of patterns. Patterns appear because of price movement. This distinction is critical because it defines causality. Traders who misunderstand this relationship treat patterns as predictive objects, while experienced traders treat them as evidence of underlying forces.
The market operates through continuous interaction between buyers and sellers. Every trade requires agreement. When buyers are more aggressive, they accept higher prices, pushing the market upward. When sellers dominate, they accept lower prices, pulling the market downward. Candlesticks visualize this negotiation over time.
A bullish candle forms when buyers maintain control from open to close. However, the strength of that control depends on how consistently buyers push price upward. A candle that closes slightly above the open shows weak control. A candle that closes near the high shows strong and sustained pressure.
Wicks add another layer of meaning. A long upper wick suggests that buyers pushed price higher but could not maintain control. Sellers stepped in and forced the price down before the close. This creates a visible rejection zone. Similarly, a long lower wick indicates rejection of lower prices.
When multiple candles are observed together, patterns begin to form. These patterns are not random. They are recurring because human behavior in markets is often repetitive. Fear, greed, hesitation, and momentum tend to produce similar structures under similar conditions.
However, repetition does not guarantee reliability. The same behavior can produce different outcomes depending on liquidity, timeframe, and broader trend direction. This is why understanding the mechanism behind candlesticks is more important than recognizing their shapes. The pattern is only the surface. The behavior is the signal.
Why Candlestick Patterns Work – And When They Fail
Candlestick patterns appear to work because they capture moments where market pressure shifts. A bullish engulfing pattern, for example, suggests that buyers have overwhelmed sellers within a short period. This creates the impression of a reversal or continuation. However, this interpretation only holds when the surrounding conditions support that shift.
Patterns work best when they align with existing market structure. A bullish pattern that forms near a support level has a higher probability of success because it coincides with an area where buyers are already expected to act. In contrast, the same pattern in the middle of a range lacks context and often fails.
Volume also plays a role. A pattern formed with strong volume indicates participation and conviction. A similar pattern with low volume may represent weak interest and is more likely to reverse. This is one reason why traders do not rely on candlesticks alone. They evaluate patterns alongside other factors such as volume, trend direction, and key price levels.
Failure occurs when traders treat patterns as standalone signals. A common mistake is entering a trade immediately after spotting a pattern without considering whether the market environment supports it. This leads to false signals, where the expected move does not materialize.
Another source of failure is overfitting. Traders memorize dozens of patterns and attempt to apply them in every situation. This reduces clarity instead of improving it. In practice, a smaller set of well-understood patterns combined with contextual analysis produces more consistent results.
Understanding when patterns fail is as important as understanding when they work. Failure reveals the limits of the signal and prevents overconfidence. It also highlights the need for confirmation and risk management, which are essential components of any trading decision.
How Traders Actually Use Candlestick Patterns in Real Decisions
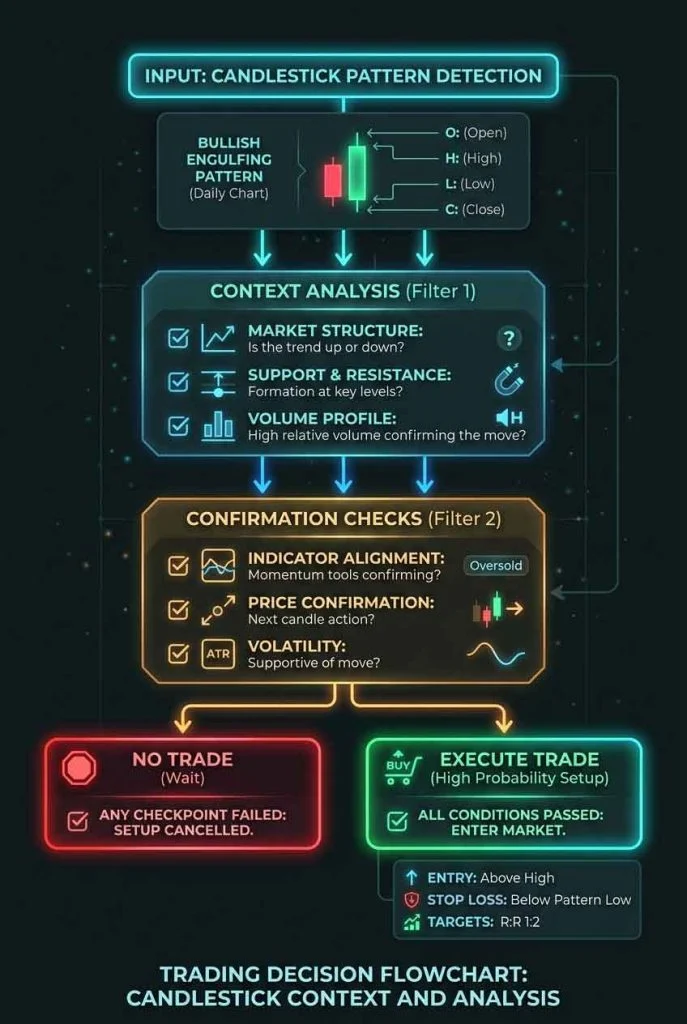
Understanding candlestick patterns becomes meaningful only when they are used within a decision framework. Professional traders do not react to patterns instantly. They evaluate whether the pattern aligns with market structure, liquidity conditions, and directional bias. This process transforms a visual signal into a probability-based decision.
The first layer of decision-making begins with context. A bullish pattern forming in a downtrend does not automatically signal a reversal. Instead, it represents a temporary shift in pressure that may or may not continue. Traders first determine whether the broader trend supports continuation or reversal. Without this context, patterns become unreliable.
The second layer is location. Candlestick patterns gain significance when they form near key price levels. These include support zones, resistance zones, previous highs and lows, and areas where liquidity is concentrated. A bullish engulfing pattern at a support level carries more weight than the same pattern in an unstructured price area. Location defines relevance.
The third layer is confirmation. Traders rarely act on a single candle. They wait for additional evidence that supports the signal. This may include a follow-through candle, increased volume, or a break of a short-term structure. Confirmation reduces false signals but introduces a trade-off, as it may delay entry.
The fourth layer is risk evaluation. Even when a pattern aligns with context, location, and confirmation, uncertainty remains. Traders define risk before entering a trade. This includes identifying invalidation points, where the trade idea is considered wrong. Candlestick patterns provide clues for these levels, often using wicks or recent highs and lows.
This structured approach explains why experienced traders appear selective. They are not reacting to every pattern. They are filtering patterns through a decision system that prioritizes probability over frequency. The pattern is only the trigger. The decision is built on multiple aligned conditions.
The Candlestick Decision Framework – From Signal to Action
To make candlestick patterns actionable, traders rely on a structured framework that converts visual information into decision logic. This framework is not fixed, but it follows a consistent sequence of evaluation that reduces randomness and improves consistency.
The process begins with trend identification. Traders assess whether the market is trending upward, trending downward, or moving sideways. This determines whether patterns are interpreted as continuation signals or potential reversals. In a strong uptrend, bullish continuation patterns are favored, while bearish patterns are often ignored or treated cautiously.
The next step is structural alignment. Traders examine whether the pattern forms at a meaningful level. These levels are not arbitrary. They are areas where previous price reactions occurred, indicating the presence of liquidity or interest. A pattern forming at these levels suggests interaction between buyers and sellers, increasing its relevance.
The third step is pressure validation. This involves evaluating how the candle formed. A strong close near the high indicates sustained buying pressure, while a long wick suggests rejection. Traders analyze whether the candle reflects decisive movement or hesitation. This helps distinguish between strong and weak signals.
The fourth step is confirmation. Traders look for additional evidence that supports the pattern. This may include a breakout above a recent high, a continuation candle, or alignment with other indicators. Confirmation is not about certainty. It is about increasing the probability that the observed behavior will continue.
The final step is execution planning. Traders define entry points, stop levels, and potential exit zones. Candlestick patterns often provide natural reference points for these decisions. For example, the low of a bullish engulfing pattern may serve as a risk boundary. This converts a visual signal into a structured trade plan.
This framework highlights an important principle. Candlestick patterns are not predictive tools. They are components within a broader decision system. Their effectiveness depends on how they are integrated into this system, not on their isolated appearance.
Candlestick Patterns vs Indicators – Which One Actually Matters More
A common question in trading is whether candlestick patterns or indicators provide more reliable signals. This comparison is often misunderstood because both serve different roles within the decision-making process.
Candlestick patterns are direct representations of price behavior. They show how buyers and sellers interacted within a specific period. This makes them immediate and context-sensitive. Patterns react instantly to changes in market conditions, allowing traders to observe shifts in pressure as they occur.
Indicators, on the other hand, are derived from price data. They apply mathematical transformations to historical prices to produce signals. This introduces a degree of delay because indicators rely on past information. However, this delay can smooth out noise and provide clearer directional guidance.
The difference becomes significant when evaluating timing and confirmation. Candlestick patterns are often used for timing entries because they reflect real-time behavior. ndicators are frequently used for confirmation because they provide a broader view of trend and momentum. For example, understanding how price structure behaves over time can be further explored in how to watch and analyse the bitcoin chart for free, where chart interpretation is broken down into practical observation steps.
Neither approach is inherently superior. The effectiveness of each depends on how they are used. Traders who rely solely on patterns may react too quickly and encounter false signals. Traders who rely only on indicators may enter too late and miss opportunities. Combining both allows for a balance between responsiveness and stability.
This comparison also reveals a deeper insight. Trading decisions are not based on a single tool. They are built through layers of information. Candlestick patterns provide the immediate signal, while indicators help validate the broader context. Understanding how these layers interact is more valuable than choosing one over the other.
Candlestick Pattern Decision Tool – Turning Patterns Into Structured Signals
Understanding patterns is one step. Applying them consistently is another. This is where a structured decision tool becomes valuable. Instead of relying on memory or subjective interpretation, traders can use a framework that evaluates multiple conditions simultaneously.
A candlestick decision tool operates by translating visual inputs into measurable factors. These factors include pattern type, trend direction, volume conditions, and location within market structure. By combining these inputs, the tool generates an output that reflects signal strength and potential risk.
The purpose of this tool is not to predict outcomes. It is to standardize evaluation. When traders rely solely on intuition, decisions can vary depending on emotion or recent outcomes. A structured tool reduces this variability by applying the same logic to every scenario.
Candlestick AI Decision Tool
Reading candlestick patterns becomes more useful when the setup is evaluated through context, volume, and location. The tool below turns those inputs into a structured interpretation so readers can move from pattern recognition to decision analysis.
Candlestick Decision Tool
Use this tool to turn a pattern observation into a structured interpretation. It is educational and probability-based.
Unlock Advanced Insight
Enter your email to unlock deeper analysis + receive a step-by-step breakdown in your inbox.
The Limits of Candlestick Patterns – Where Most Signals Break Down
Candlestick patterns create clarity by simplifying complex market behavior into recognizable structures. However, this simplification also introduces limitations. Patterns do not capture the full context of the market. They represent a narrow slice of activity within a specific timeframe, which means their signals can become misleading when interpreted without broader context.
One of the most common breakdowns occurs in low-liquidity environments. When trading volume is thin, price movements can become erratic. Candlestick patterns formed under these conditions often reflect isolated transactions rather than meaningful shifts in market pressure. As a result, patterns that appear strong on the surface may fail quickly because they lack participation.
Another limitation appears in highly volatile conditions. During periods of rapid movement, candles can form quickly and contain large price ranges. This compresses multiple shifts in sentiment into a single candle, making it difficult to distinguish between continuation and reversal signals. Traders may interpret these patterns incorrectly because the underlying behavior is too compressed to analyze clearly.
Timeframe inconsistency also creates confusion. A pattern that looks significant on a lower timeframe may disappear or lose meaning on a higher timeframe. This happens because different timeframes capture different layers of market behavior. Traders who focus on a single timeframe risk missing the broader structure that influences price movement.
Over-reliance on pattern names is another source of error. When traders memorize patterns without understanding their formation, they tend to apply them mechanically. This leads to overtrading and inconsistent results. The pattern becomes a trigger without context, increasing exposure to false signals.
Recognizing these limitations does not reduce the value of candlestick patterns. Instead, it places them within a realistic framework. Patterns are tools, not guarantees. Their effectiveness depends on how they are combined with context, confirmation, and risk management.
Real-World Scenarios – How Candlestick Signals Play Out in Different Conditions
Candlestick patterns behave differently depending on the environment in which they form. Observing how these patterns perform across different conditions provides a more accurate understanding of their reliability.
In trending markets, continuation patterns tend to dominate. For example, a bullish engulfing pattern within an uptrend often reflects a temporary pullback followed by renewed buying pressure. In this scenario, the pattern aligns with the dominant direction, increasing the probability of continuation.
In contrast, reversal patterns are more effective near structural boundaries. When price approaches a well-defined resistance level, a bearish pattern such as a shooting star may signal exhaustion of buying pressure. However, this signal becomes meaningful only when the resistance level is respected by the market. Without this context, the pattern may fail.
Sideways markets present a different challenge. In ranging conditions, price moves between support and resistance without a clear directional bias. Candlestick patterns in this environment often produce conflicting signals. A bullish pattern near resistance may fail, while a bearish pattern near support may also fail. This creates noise and reduces reliability.
News-driven environments introduce another layer of complexity. Sudden market reactions to external events can override technical signals. Candlestick patterns formed during these periods may reflect immediate reactions rather than sustained behavior. Traders must recognize when external factors dominate price movement.
These scenarios highlight a key principle. Candlestick patterns do not operate in isolation. Their effectiveness depends on alignment with broader market conditions. Understanding how patterns behave across different environments improves decision-making and reduces reliance on isolated signals. This becomes clearer when combined with broader market observation techniques explained in the best way to watch and analyse the bitcoin chart for free, where price behavior is evaluated beyond individual candles.
Visualizing Candlestick Behavior – From Pattern Recognition to Process Understanding
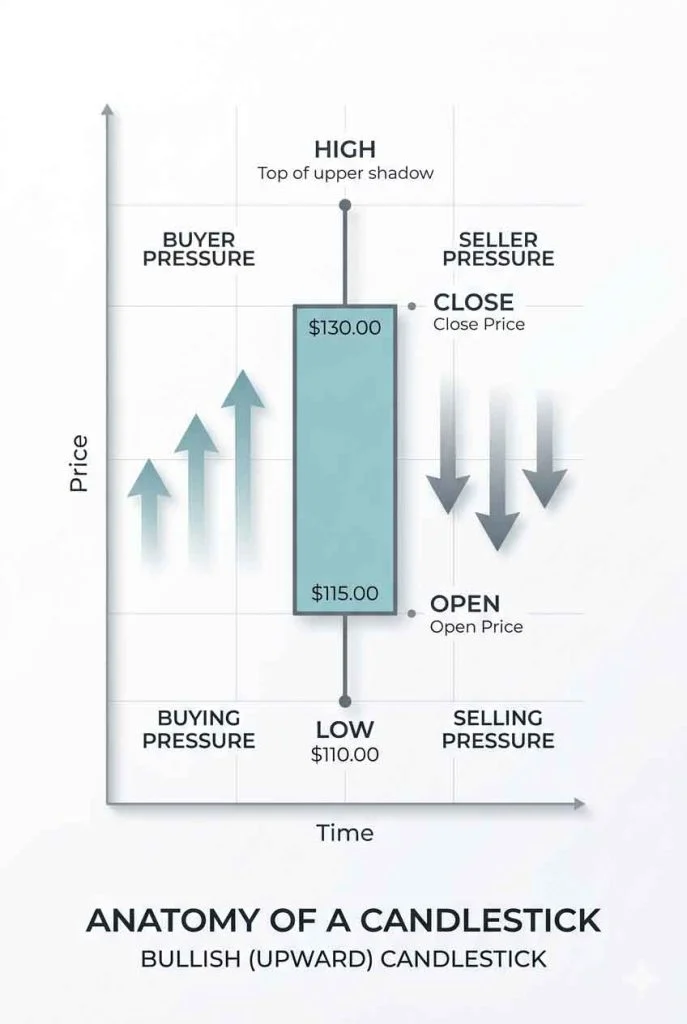
Visual representation plays a critical role in understanding candlestick patterns. While text explanations describe behavior, visual diagrams translate that behavior into observable structure. This helps both readers and search systems interpret the relationship between price movement and decision-making.
Candlestick diagrams should not be decorative. They should explain processes. A useful visual shows how a pattern forms, what behavior it represents, and how it connects to a decision outcome. This transforms the image into a semantic component that reinforces the written explanation.
Why Candlestick Patterns Remain Relevant in Modern Trading
Despite the evolution of algorithmic trading and advanced analytical tools, candlestick patterns continue to hold relevance. This is because they represent a direct visualization of market behavior, which remains driven by human decision-making even in automated environments.
Algorithms themselves are often built on patterns derived from historical price behavior. This means that the same behavioral tendencies that produce candlestick patterns are still present in modern markets. The difference lies in speed and scale, not in the underlying dynamics.
Candlestick patterns also provide accessibility. They allow traders to interpret market conditions without relying on complex models. This simplicity does not reduce their value. Instead, it makes them adaptable across different markets and timeframes.
However, their relevance depends on how they are used. Traders who integrate patterns into a structured decision framework benefit from their clarity. Those who treat patterns as standalone signals often encounter inconsistency. The difference lies in application, not in the tool itself.
Frequently Asked Questions
Do candlestick patterns work in all markets?
Candlestick patterns can be applied across different markets, including stocks, forex, and cryptocurrencies. However, their effectiveness depends on market conditions, liquidity, and how they are combined with other analysis methods.
Are candlestick patterns reliable for beginners?
Candlestick patterns can be useful for beginners when understood as part of a structured decision framework. Relying only on pattern recognition without context often leads to inconsistent results.
Which candlestick pattern is the most accurate?
No single candlestick pattern is universally accurate. The effectiveness of any pattern depends on context such as trend direction, support and resistance levels, and confirmation signals.
Can candlestick patterns predict market movement?
Candlestick patterns do not predict the market. They reflect price behavior and trader interaction, which can be used to estimate probability rather than guarantee outcomes.
Should traders use indicators with candlestick patterns?
Many traders combine candlestick patterns with indicators to improve confirmation and reduce false signals. This creates a more balanced decision-making approach between timing and trend validation.