



Why Lifetime Value Matters
In subscription and engagement-driven systems, revenue does not depend on a single transaction.
It depends on duration.
Duration determines cumulative value.
Cumulative value determines platform stability.
Lifetime value, often abbreviated as LTV, represents the total projected revenue a platform expects from a user over the duration of their activity.
LTV is not guesswork.
It is probabilistic modeling.
The longer a user remains active, the more predictable their monetization pathway becomes.
Predictability increases confidence.
Confidence informs investment decisions.
Investment strengthens retention systems.
Retention systems reinforce duration.
The loop compounds.
What Lifetime Value Really Measures
Lifetime value is influenced by several variables:
- Average revenue per period
- Retention duration
- Upgrade probability
- Microtransaction frequency
- Engagement intensity
- Payment consistency
If average revenue per month is stable and retention probability remains high, lifetime value increases.
Small increases in retention duration often produce significant increases in projected value.
For example:
A user who remains active for twelve months generates more predictable revenue than a user active for two months.
Longer duration improves forecasting accuracy.
Forecasting accuracy reduces uncertainty.
Reduced uncertainty strengthens monetization planning.
The Role of Retention in LTV
Retention is central to lifetime value prediction.
If churn probability declines over time, LTV increases.
Platforms therefore monitor retention signals continuously.
These retention layers resemble subscription-driven retention systems where return frequency stabilizes revenue prediction. Consistent engagement improves confidence in long-term value estimation.
Retention probability influences LTV projections directly.
If predicted churn risk declines, projected value increases.
Behavioral Signals as Predictive Inputs
Platforms collect behavioral signals that feed LTV models.
Common signals include:
- Login frequency
- Session duration
- Feature usage depth
- Purchase timing patterns
- Response latency
- Interaction density
These signals allow models to estimate:
- Probability of renewal
- Probability of upgrade
- Probability of churn
- Expected monetization trajectory
Behavior becomes data.
Data becomes probability.
Probability becomes projection.
Projection becomes strategy.
Time as Predictive Stabilizer
Prediction accuracy improves over time.
Early-stage users generate limited data.
Limited data produces wide prediction variance.
As interaction history grows, prediction variance narrows.
Narrow variance increases confidence.
Confidence allows platforms to segment users by value tier.
High-confidence high-LTV users may receive:
- Personalized offers
- Loyalty incentives
- Premium feature prompts
- Exclusive content previews
Lower predicted LTV segments may receive different engagement strategies.
Segmentation optimizes resource allocation.
Data Compounding and Confidence Growth
Each interaction adds data points.
Data accumulation refines predictive models.
Refined models improve LTV estimation accuracy.
Accuracy improves monetization targeting.
Targeting increases conversion efficiency.
Conversion efficiency strengthens revenue density.
Revenue density validates predictive modeling investment.
This compounding structure mirrors exposure compounding in ranking systems.
The same compounding exposure dynamics apply to value prediction systems. Historical engagement strengthens future allocation decisions.
Prediction becomes progressively more accurate as duration increases.
Risk Reduction Through Prediction
Lifetime value modeling reduces risk.
Risk reduction benefits:
- Marketing budget allocation
- Acquisition spending decisions
- Feature development prioritization
- Retention investment planning
If high-LTV users are identifiable early, acquisition targeting can adjust accordingly.
If churn probability is predictable, intervention timing can improve.
Prediction transforms uncertainty into measurable probability.
Probability supports economic planning.
Churn Prediction as Core Variable
Lifetime value depends on one critical uncertainty: when a user leaves.
Churn probability represents the likelihood that a user will discontinue activity or subscription within a defined period.
If churn probability is high, projected lifetime value declines.
If churn probability declines over time, projected lifetime value increases.
Platforms estimate churn using behavioral indicators such as:
- Declining login frequency
- Reduced session duration
- Lower feature interaction
- Payment irregularities
- Decreased content engagement
These signals feed into predictive models.
Predictive models assign probability scores.
Probability scores inform intervention strategies.
Intervention strategies aim to extend duration.
Extended duration increases lifetime value.
Cohort Analysis and Time-Based Modeling
Prediction accuracy improves when users are grouped into cohorts.
Cohorts may be defined by:
- Signup month
- Acquisition channel
- Geography
- Initial engagement behavior
- Subscription tier
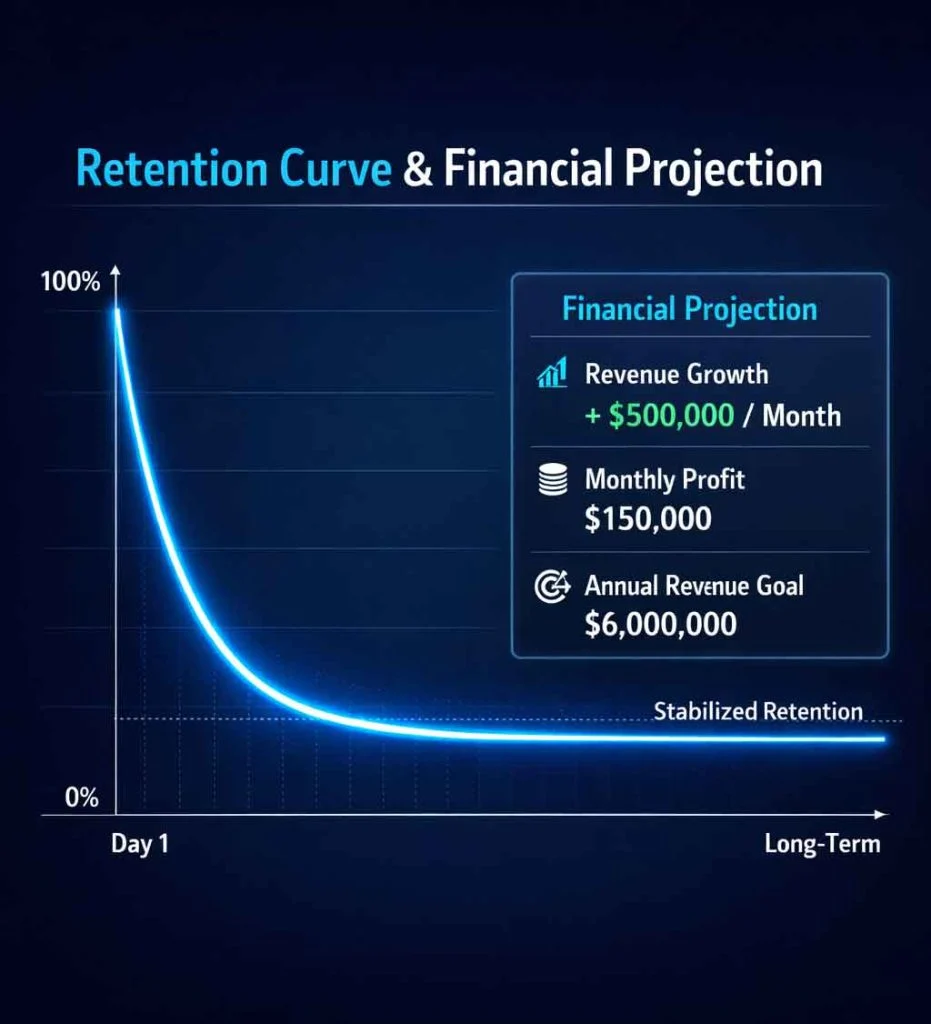
Cohort modeling reveals retention curves.
Retention curves typically show:
- Early drop-off
- Stabilization phase
- Long-tail persistence
Early-stage churn often carries the highest uncertainty.
As users move beyond early drop-off, retention probability stabilizes.
Stabilization reduces variance.
Reduced variance increases forecast confidence.
Confidence improves resource allocation efficiency.
Retention Curves and Value Forecasting
Retention curves illustrate how user activity declines over time.
A steep early decline reduces average lifetime value.
A flatter curve increases expected duration.
Platforms monitor curve slope continuously.
Small improvements in curve flattening can significantly increase projected revenue over scale.
These improvements often result from churn minimization strategies embedded in subscription systems. Retention curve optimization directly influences lifetime value estimation.
Retention curves convert behavioral history into predictive structure.
Structure reduces uncertainty.
Segmentation by Predicted Value
Not all users generate equal projected value.
Platforms categorize users into segments such as:
- High projected lifetime value
- Moderate projected lifetime value
- Low projected lifetime value
Segmentation allows differentiated strategy.
High-LTV segments may receive:
- Loyalty incentives
- Early feature access
- Personalized offers
- Dedicated support channels
Lower-LTV segments may receive:
- Re-engagement prompts
- Feature discovery nudges
- Discount trials
Resource allocation aligns with predicted return.
Prediction informs prioritization.
Early Indicators of High Value
Some early behaviors correlate strongly with long-term retention.
Examples include:
- Completing onboarding fully
- Engaging with multiple features early
- Making an initial purchase quickly
- Establishing social connections
- Returning within 24 hours of first session
Early behavioral patterns reduce prediction variance.
Lower variance increases forecast reliability.
Reliable forecasts justify acquisition spending.
Acquisition spending expands user base.
User base expansion increases model data.
Model data improves prediction precision.
Precision compounds.
Revenue Forecasting Models
Revenue forecasting combines:
- Average revenue per user
- Retention curve slope
- Upgrade probability
- Microtransaction frequency
Forecasting models simulate scenarios such as:
- Increased churn
- Improved engagement
- Price adjustment
- Feature expansion
Simulations estimate revenue impact.
Impact estimation guides decision-making.
Decision-making influences product design.
Product design influences engagement.
Engagement influences retention.
Retention influences lifetime value.
The system interconnects.
Data Density and Prediction Accuracy
Prediction reliability improves as data density increases.
Data density refers to:
- Number of interactions per user
- Diversity of feature engagement
- Length of activity history
- Transaction consistency
High data density reduces uncertainty.
Low data density increases volatility.
Volatility complicates resource planning.
Platforms therefore encourage behaviors that increase data density.
Increased data density strengthens predictive modeling.
This dynamic parallels performance-based identity systems where engagement history shapes exposure probability. In both cases, accumulated data strengthens allocation decisions.
Prediction thrives on history.
History stabilizes projection.
AI-Driven Personalization and Lifetime Value Optimization
Lifetime value prediction is not static.
Modern platforms continuously update projections in real time.
As new behavioral signals emerge, predictive scores adjust.
AI-driven systems monitor:
- Engagement fluctuations
- Purchase timing changes
- Session frequency shifts
- Content interaction depth
- Response patterns to prompts
When probability of churn increases, intervention may trigger.
When upgrade probability increases, premium prompts may appear.
Prediction does not merely observe.
It influences design.
Design influences behavior.
Behavior influences future prediction.
Prediction and personalization operate as a feedback loop.
Real-Time Value Adjustment
Early projections of lifetime value carry uncertainty.
As time passes, confidence intervals narrow.
Platforms continuously recalibrate:
- Retention probability
- Revenue expectation
- Upgrade likelihood
- Engagement depth
If a user increases usage frequency unexpectedly, projected value rises.
If engagement declines sharply, projected value may drop.
These adjustments occur dynamically.
Dynamic scoring enables adaptive allocation.
Adaptive allocation optimizes monetization pathways.
Prediction becomes operational, not theoretical.
Acquisition Targeting Based on Predicted Value
Lifetime value modeling influences acquisition strategy.
Platforms evaluate:
- Cost per acquisition
- Predicted retention probability
- Expected monetization density
- Churn risk profiles
If predicted LTV exceeds acquisition cost by a sustainable margin, acquisition investment expands.
If predicted value declines, acquisition spending contracts.
Prediction governs marketing efficiency.
Efficiency determines scalability.
Scalability shapes market expansion.
Behavioral Signals as Economic Filters
Predictive systems effectively filter users by projected value.
Filtering does not remove users.
It influences resource allocation intensity.
High predicted value users may receive:
- Priority feature access
- Faster support response
- Higher personalization density
Lower predicted value users may receive standardized experiences.
Allocation asymmetry reflects economic optimization.
Optimization reflects probabilistic modeling.
Modeling reflects accumulated data.
Data becomes strategic leverage.
Data Accumulation as Competitive Moat
Platforms with longer operating history possess deeper behavioral datasets.
Deep datasets improve prediction accuracy.
Improved accuracy reduces revenue volatility.
Reduced volatility strengthens strategic planning.
Strategic stability increases competitive advantage.
This accumulation effect creates data moats.
A data moat exists when:
- Historical behavior cannot be replicated easily
- Prediction accuracy exceeds competitors
- Retention interventions improve over time
These advantages contribute to structural concentration effects within digital markets. Superior prediction capability strengthens competitive position.
Prediction compounds with scale.
Scale compounds with prediction.
Platform Asymmetry and Information Advantage
Users typically do not see their predicted lifetime value score.
Platforms, however, model users probabilistically.
This asymmetry creates informational imbalance.
Platforms understand:
- Behavioral probability
- Retention risk
- Revenue projection
- Engagement elasticity
Users experience interface prompts.
Platforms observe statistical patterns.
This structural difference enables optimized allocation.
Optimization enhances monetization predictability.
Predictability reinforces platform stability.
Ethical and Structural Considerations
Prediction-based allocation raises structural questions:
- How transparent should predictive scoring be?
- Should segmentation influence user experience intensity?
- Does probabilistic modeling shape behavior indirectly?
These questions are systemic rather than moral in isolation.
Prediction shapes incentives.
Incentives shape design.
Design shapes user behavior.
Behavior feeds prediction.
The loop sustains itself.
Understanding the loop clarifies why engagement tracking intensifies over time.
More data reduces uncertainty.
Reduced uncertainty improves forecast accuracy.
Forecast accuracy stabilizes revenue.
Revenue stability supports platform expansion.
Long-Term Lifetime Value Equilibrium
Lifetime value prediction eventually reaches stability zones.
In early stages, volatility is high.
Behavior is limited.
Variance is wide.
As duration increases:
- Behavioral history expands
- Churn probability stabilizes
- Revenue per period becomes predictable
- Upgrade likelihood becomes measurable
Prediction intervals narrow.
Narrow intervals increase economic confidence.
Economic confidence enables:
- Long-term infrastructure investment
- Strategic pricing models
- Product expansion planning
- Market positioning refinement
Equilibrium forms when retention probability, monetization density, and churn risk reach statistical consistency.
At equilibrium, forecast deviation decreases significantly.
Stability improves capital allocation efficiency.
Revenue Durability Modeling
Durability refers to how resistant projected revenue is to external shocks.
External shocks may include:
- Pricing adjustments
- Feature redesign
- Competitive entry
- Algorithmic shifts
- Market contraction
Durable LTV profiles typically exhibit:
- Stable renewal rates
- Predictable engagement frequency
- Consistent monetization cadence
- Low churn volatility
Durability increases enterprise resilience.
Resilience supports long-term strategic growth.
Durability is not purely transactional.
It is behavioral.
Behavior underpins projection.
Projection informs allocation.
Allocation shapes sustainability.
Marginal Retention and Exponential Impact
Small improvements in retention duration can disproportionately increase projected value.
If churn is reduced slightly in early lifecycle stages, long-tail value expands.
This is because lifetime value accumulates multiplicatively across duration periods.
This phenomenon is central to retention curve optimization in subscription systems. Even minor early improvements reshape long-term value projections.
Retention leverage explains why platforms prioritize onboarding refinement.
Early-stage stability reduces long-term volatility.
Volatility reduction increases durability.
Predictive Systems and Competitive Scale

Platforms operating at scale refine predictive models faster.
Larger user bases produce:
- More behavioral variation
- Richer churn patterns
- Deeper engagement signals
- Higher transaction diversity
Model training improves with volume.
Improved modeling increases forecast precision.
Precision reduces monetization waste.
Reduced waste increases profit density.
Profit density funds further model refinement.
Scale reinforces prediction advantage.
Prediction advantage strengthens competitive positioning.
Positioning influences market concentration.
This feedback loop contributes to scale-driven concentration dynamics in digital ecosystems. Predictive superiority compounds with user base expansion.
Prediction Under Scarcity
Across digital behavioral systems, several structural realities emerge:
- Attention is finite.
- Retention determines durability.
- Data reduces variance.
- Prediction guides allocation.
- Allocation shapes monetization density.
- Duration stabilizes revenue.
Lifetime value prediction transforms behavioral uncertainty into structured probability.
Probability supports economic modeling.
Economic modeling influences design.
Design influences behavior.
Behavior feeds prediction.
The loop compounds.
Understanding this loop clarifies why engagement tracking, churn modeling, and personalization systems intensify over time.
Prediction is foundational to revenue stability.
Conclusion
User lifetime value is not a static metric.
It is a probabilistic forecast built from behavioral signals, retention duration, and predictive modeling.
The longer a user remains active, the narrower forecast variance becomes.
Narrow variance increases strategic confidence.
Confidence supports sustainable monetization planning.
Prediction underpins:
- Retention engineering
- Acquisition targeting
- Revenue durability
- Competitive scale
Lifetime value is therefore a structural outcome of behavioral modeling within attention-constrained digital ecosystems.
Predictability compounds with duration.
Duration compounds with retention.
Retention compounds with engagement.
Engagement compounds with allocation.
Allocation compounds with revenue stability.
Revenue stability defines platform durability.
FAQs
What is user lifetime value?
User lifetime value represents the projected cumulative revenue a platform expects from a user over the duration of their activity, based on probabilistic modeling of retention and monetization behavior.
How do platforms predict churn?
Platforms analyze behavioral signals such as login frequency, engagement depth, and transaction patterns to estimate the probability that a user will discontinue activity within a defined time frame.
Why does retention affect lifetime value so strongly?
Even small improvements in retention duration can significantly increase projected lifetime value because cumulative revenue compounds over extended activity periods.
What creates a data moat in digital platforms?
A data moat forms when accumulated historical user behavior improves predictive accuracy beyond competitors, strengthening monetization efficiency and long-term strategic advantage.