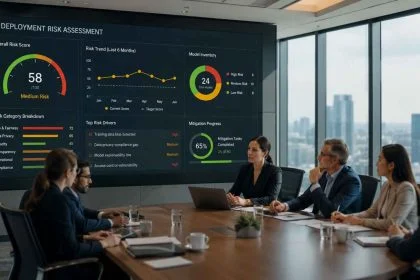



Organizations rarely struggle to measure activity. They struggle to measure success.
This distinction sits at the center of one of the most misunderstood challenges in enterprise AI. Most leadership teams can quickly identify how many models have been deployed, how many workflows have been automated, how many employees are using AI-enabled tools, and how much time appears to be saved through automation. These figures are visible, easy to collect, and convenient to place inside executive dashboards. The problem is that visibility does not automatically create understanding.
Many AI initiatives begin with impressive numbers. Productivity increases. Processing times decrease. Operational throughput improves. Customer interactions become faster. Reports begin highlighting positive outcomes. Leadership gains confidence that deployment objectives are being achieved.
Yet months later, organizations often discover that the picture was incomplete.
The reason is surprisingly simple. Measuring AI activity is relatively easy. Measuring AI impact is considerably more difficult because enterprise outcomes rarely emerge from a single metric. Success often depends upon a combination of operational performance, governance quality, accountability clarity, risk exposure, customer outcomes, organizational resilience, and long-term sustainability.
This complexity creates a challenge that many organizations underestimate. The metrics that appear most useful during early deployment are frequently the metrics least capable of explaining long-term success.
As AI adoption expands across departments, business functions, and decision-making processes, measurement becomes less about tracking efficiency and more about understanding organizational influence. A model may improve productivity while simultaneously increasing governance complexity. An automated workflow may reduce labor hours while introducing new oversight requirements. A successful pilot may generate positive ROI while creating operational dependencies that remain invisible to executive reporting systems.
This explains why some organizations believe AI is succeeding while hidden risks continue accumulating beneath the surface. The dashboard is accurate. The interpretation is incomplete.
Understanding this difference is essential because enterprise AI success is rarely determined by what organizations choose to measure. It is often determined by what they fail to measure.
Why Most Organizations Measure The Wrong Things

The challenge with AI measurement is not the absence of metrics. The challenge is the abundance of metrics that are easy to collect but difficult to interpret.
Most organizations begin their measurement journey with good intentions. Leadership teams want visibility. Project sponsors want accountability. Technology teams want evidence that deployment efforts are producing results. Finance departments want justification for investment decisions.
The result is usually a growing collection of dashboards filled with indicators that appear useful because they are readily available.
Organizations track:
- hours saved
- tasks automated
- model usage
- user adoption
- processing speed
- operational throughput
These figures often become the foundation of executive reporting.
The problem is that convenience and importance are not the same thing.
Many of the metrics that dominate enterprise reporting are popular precisely because they are easy to calculate. Unfortunately, the factors that determine long-term AI success are often much harder to measure.
As a result, organizations frequently become highly informed about operational activity while remaining surprisingly uninformed about strategic impact.
AI Measurement Improvement Planner
Identify missing AI success metrics, dashboard blind spots, governance gaps and the next measurements your organization should add.
1. Current AI Measurement
2. Practical Context
Why Measurement Bias Develops Naturally
Measurement bias does not emerge because organizations are careless.
It emerges because every measurement framework reflects human preferences.
Executives naturally prefer indicators that:
- are easy to understand
- update frequently
- demonstrate progress
- support decision-making
These preferences are reasonable.
However, they create a predictable tendency toward visible indicators and away from structural indicators.
For example, productivity improvements are easy to communicate during leadership meetings. Governance quality is more difficult to summarize.
Automation rates can be displayed on a dashboard. Accountability clarity is harder to visualize.
Time savings can be converted into financial estimates. Oversight effectiveness often requires interpretation.
Because visible metrics are easier to communicate, they gradually dominate reporting environments.
The result is not inaccurate reporting.
The result is incomplete reporting.
Why Efficiency Becomes The Default Definition Of Success

Many AI deployments begin with efficiency objectives.
Organizations seek to:
- reduce manual work
- accelerate processing
- improve operational throughput
- lower administrative burden
When efficiency is the primary objective, efficiency metrics naturally become the primary measurement framework.
This approach works well during early deployment stages.
However, AI systems rarely remain limited to efficiency improvements.
As deployments mature, they begin influencing:
- decisions
- workflows
- customer experiences
- operational risk
- governance requirements
At that point, efficiency becomes only one dimension of performance.
The challenge is that many organizations continue evaluating mature AI deployments using measurement frameworks originally designed for early-stage automation projects.
This creates a mismatch between what AI influences and what leadership measures.
Why Executive Dashboards Often Create Blind Spots
Executive dashboards play an important role in modern organizations.
They help leaders process large amounts of information quickly.
The challenge is that dashboards simplify reality.
Every dashboard requires choices regarding:
- what to include
- what to exclude
- how to prioritize indicators
- how to summarize complexity
These choices inevitably create blind spots.
Consider two organizations.
The first reports:
- productivity gains
- automation growth
- cost savings
- adoption rates
The second reports:
- productivity gains
- governance participation
- escalation frequency
- ownership clarity
- operational exceptions
Both organizations measure performance.
The second organization measures organizational health as well.
This distinction often becomes important long before visible problems emerge.
Why Positive Metrics Can Hide Emerging Weaknesses
One of the most dangerous measurement challenges occurs when positive indicators conceal developing vulnerabilities.
Imagine an organization experiencing:
- rising productivity
- lower processing times
- increasing adoption
- strong executive support
These outcomes appear positive.
At the same time, the organization may also experience:
- declining governance participation
- weaker oversight
- unclear accountability
- increasing exception volumes
If only the positive indicators reach leadership dashboards, decision-makers may conclude that deployment quality is improving.
In reality, deployment complexity may be growing faster than governance capability.
This creates a situation where success indicators and risk indicators move in opposite directions.
Organizations that monitor only one side of the equation often misinterpret the overall picture.
Why Governance Indicators Are Frequently Ignored
Governance indicators rarely receive the same attention as performance indicators.
There are several reasons for this.
First, governance metrics are often more difficult to quantify.
Second, governance indicators may appear less relevant during periods of strong performance.
Third, governance weaknesses rarely produce immediate consequences.
As a result, organizations frequently postpone governance measurement until after problems emerge.
This sequence is backwards.
Governance indicators are most valuable before incidents occur because they provide visibility into conditions that may eventually create operational disruption.
Mature enterprises understand that governance metrics function much like preventive maintenance indicators.
They are designed to reveal emerging weaknesses before visible damage appears.
Many recurring enterprise AI failure patterns begin when organizations rely heavily on operational metrics while neglecting governance indicators.
Why Efficiency Metrics Create False Confidence
One of the most common measurement mistakes in enterprise AI occurs when organizations confuse efficiency improvement with overall success. The confusion is understandable because efficiency gains are usually the first visible outcomes produced by AI deployment. Processing times decline, manual work decreases, workflows accelerate, and dashboards begin showing positive trends. Leadership sees evidence of progress and naturally assumes that broader organizational performance is improving as well.
The challenge is that efficiency represents only one dimension of enterprise performance.
An organization can become more efficient while simultaneously becoming more vulnerable. This is not a contradiction. It is a consequence of measuring one outcome while ignoring others.
Consider an enterprise that successfully automates a large portion of its customer service operation. Average response times improve dramatically. Customer inquiries are processed faster. Operating costs decline. Productivity metrics improve across multiple departments.
From an efficiency perspective, the deployment appears highly successful.
However, the same organization may also experience growing governance complexity, increasing oversight requirements, unclear accountability for automated decisions, and expanding operational dependency on AI-supported workflows. None of these conditions necessarily appear inside efficiency dashboards.
As a result, leadership receives a positive picture that is technically accurate but strategically incomplete.
Why Early ROI Can Create Measurement Distortion
Many cases of AI ROI collapse begin with strong efficiency metrics that fail to reveal growing governance, oversight, and operational complexity.
Early-stage AI deployments often generate strong ROI results.
This occurs because the first projects selected for implementation are usually chosen carefully. Organizations prioritize opportunities with clear objectives, measurable outcomes, and manageable complexity. Success becomes easier to achieve because deployment occurs in controlled environments.
The challenge emerges when leadership begins using those early results as a template for evaluating future deployments.
As AI expands into more complex business functions, measurement becomes significantly more difficult. Outcomes become influenced by multiple variables. Governance requirements increase. Risk exposure expands. Accountability structures become more important.
Yet organizations frequently continue using the same measurement framework that worked during the pilot phase.
This creates measurement distortion.
The metrics remain accurate.
The context changes.
Leadership may believe performance remains strong because the dashboard still shows positive ROI. Meanwhile, organizational complexity grows faster than the measurement framework’s ability to capture it.
Why Productivity Gains Can Coexist With Growing Risk

Many executives assume that increasing productivity automatically indicates decreasing risk.
In reality, productivity and risk often operate independently.
An organization may process more transactions, automate more workflows, and support more decisions while governance maturity remains unchanged.
This creates an important question:
Is the organization becoming more capable, or simply becoming more dependent?
The distinction matters because dependency introduces new forms of risk.
As AI becomes embedded in daily operations, organizations often rely on:
- automated recommendations
- predictive outputs
- workflow automation
- operational decision support
Each dependency increases the importance of oversight.
If governance structures do not mature at the same pace as deployment, productivity improvements can occur alongside increasing organizational exposure.
This is one reason why some enterprises experience significant AI-related incidents shortly after periods of apparent success.
The productivity metrics were real.
The risk indicators were simply absent from reporting systems.
Why Operational Success And Organizational Success Are Not The Same Thing
Operational success focuses on execution.
Organizational success focuses on sustainability.
The distinction becomes increasingly important as AI deployment scales.
Operational success may include:
- reduced processing times
- lower administrative effort
- improved throughput
- increased automation
These outcomes are valuable.
However, organizational success also requires:
- governance sustainability
- accountability clarity
- oversight effectiveness
- risk visibility
- decision ownership
An organization can achieve operational success while gradually weakening its ability to manage future complexity.
This is why mature enterprises evaluate performance through multiple lenses rather than relying exclusively on efficiency indicators.
They recognize that operational performance explains what is happening today, while governance and oversight indicators help explain what may happen tomorrow.
Why Dashboards Tend To Reward Short-Term Thinking
Most executive dashboards are designed around visibility and speed.
Leaders need information quickly.
Boards need concise reporting.
Stakeholders expect simple indicators.
The result is a natural preference for short-term measurements.
Examples include:
- monthly productivity
- quarterly savings
- adoption rates
- operational output
These indicators provide valuable information, but they rarely capture long-term organizational conditions.
Governance deterioration may develop slowly.
Oversight erosion may occur gradually.
Accountability confusion may emerge over multiple quarters.
Because these developments unfold over time, they often receive less attention than rapidly changing operational metrics.
The consequence is predictable.
Organizations become highly responsive to short-term performance fluctuations while remaining relatively blind to slow-moving structural risks.
Why The Best Metrics Often Feel Uncomfortable
An interesting characteristic of mature measurement frameworks is that they often include indicators leaders would rather not discuss.
Examples include:
- unresolved exceptions
- escalation delays
- governance participation rates
- ownership disputes
- audit findings
- control weaknesses
These metrics rarely appear in marketing presentations.
They rarely attract positive attention.
Yet they often provide a clearer picture of organizational health than productivity indicators alone.
The reason is simple.
Positive metrics describe performance.
Difficult metrics describe resilience.
Organizations that measure both gain a more complete understanding of AI success.
Organizations that measure only one side of the equation often discover weaknesses after they become expensive.
Why AI Success Extends Beyond Productivity
One of the most important shifts that mature organizations make is recognizing that AI success cannot be reduced to productivity alone. Productivity remains valuable because it provides visible evidence that systems are generating operational impact. However, enterprise AI eventually influences far more than workflow efficiency.
As deployment expands, AI begins affecting decision-making, customer experiences, risk management processes, governance structures, resource allocation, and organizational adaptability. At that point, productivity becomes only one indicator within a much larger system of outcomes.
Organizations that continue evaluating AI solely through productivity metrics often underestimate both the benefits and the risks associated with long-term deployment.
The question gradually changes from:
“How much work did AI save?”
to:
“How is AI changing the organization?”
The second question is significantly harder to answer, but it is usually the more important one.
Why Customer Outcomes Often Matter More Than Internal Efficiency
Many AI projects begin with internal objectives.
Organizations seek to:
- reduce manual effort
- improve processing speed
- lower operational costs
- streamline workflows
These objectives are understandable because they are measurable and directly connected to business operations.
However, customers rarely experience AI through efficiency statistics.
Customers experience outcomes.
For example, customers notice:
- service quality
- response accuracy
- decision consistency
- issue resolution effectiveness
- overall experience
An organization may achieve significant internal productivity gains while creating little meaningful improvement for customers.
Conversely, a deployment may generate moderate productivity gains while dramatically improving customer outcomes.
From a long-term business perspective, the second scenario is often more valuable.
This is why mature enterprises increasingly connect AI measurement to customer impact rather than relying exclusively on internal efficiency indicators.
Why Decision Quality Is Frequently Overlooked
Many organizations carefully measure how quickly decisions are made.
Far fewer measure whether decisions improve.
This distinction becomes increasingly important as AI begins influencing strategic and operational activities.
Decision quality can affect:
- customer retention
- operational performance
- risk exposure
- compliance outcomes
- resource allocation
Yet decision quality remains difficult to quantify.
Unlike productivity, there is rarely a single dashboard that clearly displays decision effectiveness.
As a result, organizations frequently focus on speed because speed is measurable.
Quality receives less attention because quality requires interpretation.
Over time, this imbalance can create misleading conclusions.
Faster decisions do not automatically become better decisions.
Organizations that understand this distinction generally develop more balanced measurement frameworks.
Why Governance Quality Influences Long-Term Performance
Governance is often viewed as a control function rather than a performance function.
This perception creates a common measurement blind spot.
Strong governance does more than reduce risk.
It improves organizational stability.
Effective governance supports:
- accountability clarity
- escalation readiness
- oversight consistency
- decision transparency
- operational resilience
These characteristics rarely produce immediate productivity gains.
Instead, they influence the organization’s ability to sustain performance as complexity increases.
This is why governance quality frequently becomes visible only after organizations encounter scale, growth, or disruption.
Enterprises with strong governance often absorb complexity more effectively than enterprises that focus exclusively on operational performance.
Why Accountability Indicators Deserve Executive Attention
Strong executive AI accountability often improves both governance quality and long-term organizational resilience.
Accountability is one of the least measured dimensions of enterprise AI success.
Most organizations assume accountability exists.
Fewer organizations verify it.
Accountability indicators can include:
- ownership clarity
- decision authority definition
- escalation responsibility
- intervention readiness
- outcome ownership
These indicators rarely appear in traditional AI performance reports.
Yet accountability gaps often become visible during periods of organizational stress.
When something goes wrong, leadership quickly discovers whether ownership structures are clear or ambiguous.
The challenge is that waiting for failure is an expensive way to evaluate accountability.
Mature organizations increasingly measure accountability before incidents occur rather than after incidents expose weaknesses.
Why Organizational Resilience Is The Ultimate Success Metric
Perhaps the most overlooked measurement dimension is resilience.
Resilience reflects an organization’s ability to:
- adapt to change
- manage complexity
- absorb disruption
- sustain performance
- respond to unexpected events
Unlike productivity, resilience rarely produces immediate headline metrics.
Its value becomes visible when conditions change.
For example:
A highly productive AI deployment may perform well under normal conditions.
A resilient AI deployment continues performing when conditions become unpredictable.
The distinction becomes increasingly important as AI systems influence larger portions of enterprise operations.
Organizations that prioritize resilience often develop stronger long-term performance because they measure more than immediate outcomes.
They measure durability.
Why Mature Enterprises Expand Their Measurement Horizon
Less mature organizations often focus on current performance.
Mature enterprises focus on future performance as well.
This broader perspective leads them to measure:
- current efficiency
- customer outcomes
- governance quality
- accountability strength
- organizational resilience
- long-term sustainability
The objective is not to create more metrics.
The objective is to create better understanding.
What organizations measure shapes what organizations improve. What organizations ignore often shapes future risk.
When organizations evaluate AI through multiple dimensions, they reduce the likelihood that important risks remain hidden behind positive operational results.
This creates a more balanced view of success and a more accurate understanding of enterprise performance.
Why Organizations Misread Positive Results

One of the most persistent challenges in enterprise AI measurement is that positive results are often easier to observe than emerging weaknesses. Organizations naturally focus on evidence that confirms progress because progress supports investment decisions, validates deployment strategies, and demonstrates operational value.
The difficulty is that positive indicators can create a misleading sense of certainty when they are viewed in isolation.
An enterprise may report:
- higher productivity
- lower operating costs
- faster processing
- increased automation
- growing adoption
All of these outcomes may be completely accurate.
However, accuracy does not automatically equal completeness.
The same organization may simultaneously experience growing governance complexity, expanding oversight requirements, accountability uncertainty, rising exception volumes, and increasing operational dependency on AI-supported processes.
If these conditions are not measured, leadership receives only part of the story.
This is how organizations can become more successful operationally while becoming more vulnerable organizationally.
Why Dashboards Often Reward The Wrong Signals
Many organizations develop AI reporting blind spots when dashboards focus heavily on operational gains while governance indicators receive limited visibility.
Most executive reporting systems are designed to highlight performance.
Performance indicators attract attention because they demonstrate movement.
Examples include:
- productivity increases
- automation growth
- cost reductions
- efficiency improvements
These indicators are valuable.
The challenge is that they often dominate executive attention while slower-moving indicators receive limited visibility.
Governance participation does not usually generate headlines.
Ownership clarity rarely appears in quarterly reporting summaries.
Escalation effectiveness seldom becomes a board-level discussion unless something has already gone wrong.
As a result, dashboards frequently reward visible success while overlooking developing weaknesses.
The reporting system is functioning correctly.
The measurement framework is incomplete.
Why Growth Creates Measurement Blind Spots
Strong performance often encourages expansion.
Organizations that experience early AI success naturally seek additional opportunities.
New departments adopt AI.
Additional workflows become automated.
Decision support systems expand into new operational areas.
This growth appears positive.
The challenge is that measurement frameworks often fail to evolve at the same pace.
Leadership may continue monitoring the same indicators that proved useful during initial deployment even though organizational complexity has increased substantially.
As complexity grows, new risks emerge:
- coordination challenges
- accountability diffusion
- governance workload
- oversight demands
If reporting systems remain unchanged, these developments can remain largely invisible.
Growth therefore becomes one of the most common sources of measurement blind spots.
Why Positive Trends Can Hide Negative Conditions
An important principle of enterprise measurement is that positive trends and negative conditions can exist simultaneously.
For example:
| Positive Trend | Hidden Condition |
|---|---|
| Productivity growth | Governance workload expansion |
| Faster decisions | Reduced decision review |
| Higher automation | Greater operational dependency |
| Cost savings | Increasing oversight requirements |
| Strong adoption | Accountability ambiguity |
Organizations frequently focus on the left side of the table because those indicators are easier to communicate.
The right side often receives attention only after consequences become visible.
Mature enterprises deliberately measure both.
Why Interpretation Matters More Than Data Collection
Most enterprises are not suffering from a lack of information.
They are suffering from an interpretation challenge.
Modern organizations collect enormous volumes of operational data.
The question is rarely:
Do we have enough information?
The question is more often:
Are we interpreting the information correctly?
A dashboard showing positive outcomes may indicate genuine success.
It may also indicate that the measurement framework is capturing only part of the organizational reality.
This is why mature enterprises invest significant effort into understanding relationships between indicators rather than evaluating metrics independently.
The objective is not simply to collect data.
The objective is to understand what the data actually means.
Why Mature Organizations Challenge Positive Results
Less mature organizations celebrate positive metrics.
Mature organizations investigate them.
This does not mean mature enterprises are pessimistic.
It means they recognize that positive outcomes deserve scrutiny just as much as negative outcomes.
When productivity rises, they ask:
- What else changed?
- Did governance scale appropriately?
- Are accountability structures still clear?
- Has oversight quality remained stable?
- Are exception rates increasing?
These questions help organizations distinguish genuine improvement from incomplete visibility.
Over time, this discipline produces stronger measurement frameworks and more sustainable deployment outcomes.
The Hidden Metrics That Predict Long-Term Success

One of the most consistent findings across mature AI deployments is that the metrics most commonly discussed during executive meetings are not always the metrics most capable of predicting future success.
Organizations naturally focus on visible outcomes. Productivity improvements attract attention because they are easy to communicate. Cost savings appear in financial reports. Automation rates can be displayed on dashboards. Adoption statistics provide evidence that deployment is progressing.
These measurements are useful.
The challenge is that they are primarily lagging indicators.
Lagging indicators explain what has already happened.
Leading indicators help explain what may happen next.
The distinction is important because many enterprise AI failures develop long before traditional performance metrics begin showing signs of trouble.
Organizations that understand this difference often develop stronger governance structures, better oversight systems, and more sustainable deployment practices because they learn to monitor conditions rather than waiting for consequences.
Why Governance Participation Is A Leading Indicator
Many organizations establish governance structures during the early stages of AI adoption.
Committees are formed.
Review processes are documented.
Policies are created.
Oversight mechanisms are introduced.
The existence of these structures is important.
However, their effectiveness depends upon participation.
Governance participation reflects whether decision-makers remain actively engaged in oversight activities as deployment complexity increases.
Participation indicators may include:
- review attendance
- escalation responsiveness
- policy compliance reviews
- governance meeting frequency
- risk assessment completion rates
Declining participation rarely creates immediate disruption.
Instead, it gradually reduces organizational visibility.
As visibility decreases, weak signals become harder to detect.
This is why governance participation often functions as an early warning indicator for future oversight problems.
Why Escalation Effectiveness Predicts Organizational Resilience
Many enterprises document escalation procedures.
Far fewer evaluate whether escalation systems actually work.
Escalation effectiveness measures how efficiently concerns move through an organization toward individuals capable of taking action.
Questions worth examining include:
- Are issues reported quickly?
- Are concerns reviewed consistently?
- Are decisions made within expected timeframes?
- Are responsibilities understood?
- Are corrective actions completed?
When escalation systems operate effectively, organizations can respond rapidly to emerging risks.
When escalation systems become slow or inconsistent, small concerns often remain unresolved until they evolve into larger problems.
The difference is rarely visible inside productivity dashboards.
It becomes visible during moments of operational stress.
This is why escalation effectiveness frequently predicts resilience more accurately than efficiency metrics alone.
Why Ownership Clarity Reveals Hidden Organizational Risk
Ownership appears simple until organizations attempt to document it.
Many enterprises assume ownership is obvious because roles and responsibilities exist on paper.
Reality is often more complicated.
As AI systems expand across departments, ownership frequently becomes distributed among:
- business leaders
- technology teams
- compliance teams
- operations teams
- external vendors
This distribution can create ambiguity.
When ownership becomes unclear, decision-making slows, escalation becomes inconsistent, and accountability weakens.
Ownership clarity therefore functions as a valuable leading indicator because it reveals whether responsibility structures remain aligned with operational complexity.
Organizations with strong ownership clarity generally respond faster, coordinate more effectively, and manage growth more successfully.
Why Exception Management Often Predicts Future Problems
Most organizations experience exceptions.
Exceptions are not necessarily signs of failure.
They are signs that reality differs from expectations.
Examples include:
- policy exceptions
- workflow exceptions
- model exceptions
- operational exceptions
- compliance exceptions
The important question is not whether exceptions occur.
The important question is how organizations manage them.
Mature enterprises monitor:
- exception frequency
- exception severity
- resolution speed
- recurring exception patterns
An increasing volume of unresolved exceptions often indicates that complexity is growing faster than organizational controls.
This trend frequently appears before larger governance or operational issues become visible.
Why Oversight Consistency Matters More Than Oversight Intensity
Effective leading indicators help organizations maintain sustainable AI oversight even as deployment complexity increases over time.
Many organizations focus heavily on oversight during the first stages of deployment.
Executive attention is high.
Review meetings occur frequently.
Performance receives close scrutiny.
Over time, attention often shifts elsewhere.
This transition creates a critical measurement challenge.
Strong oversight for six months followed by declining oversight for three years does not produce sustainable governance.
What matters is consistency.
Oversight consistency reflects whether organizations maintain visibility as deployments mature.
Indicators may include:
- review regularity
- governance continuity
- monitoring stability
- leadership participation
- control verification
Consistent oversight helps organizations identify gradual changes before those changes become significant risks.
Inconsistent oversight frequently allows vulnerabilities to accumulate unnoticed.
Why Leading Indicators Outperform Lagging Indicators
Most enterprise AI reporting remains heavily focused on outcomes.
Organizations review:
- efficiency improvements
- productivity gains
- financial returns
- adoption growth
These indicators remain valuable because they help explain performance.
However, they often arrive too late to support prevention.
Leading indicators focus on conditions rather than outcomes.
Examples include:
| Leading Indicator | What It Predicts |
|---|---|
| Governance participation | Oversight quality |
| Ownership clarity | Accountability strength |
| Escalation effectiveness | Response capability |
| Exception management | Operational stability |
| Oversight consistency | Long-term governance sustainability |
Organizations that monitor leading indicators gain earlier visibility into emerging challenges.
Rather than waiting for failures to become visible, they identify conditions that make failure more likely.
This creates opportunities for earlier intervention and more informed decision-making.
Why Mature Measurement Frameworks Combine Both
The strongest enterprises do not choose between leading and lagging indicators.
They combine them.
Lagging indicators explain results.
Leading indicators explain conditions.
Together, they create a more complete understanding of organizational performance.
This balanced approach helps leadership answer two important questions simultaneously:
- What outcomes are we producing today?
- What conditions are shaping future outcomes?
Organizations capable of answering both questions generally develop stronger governance, more sustainable deployment practices, and greater long-term confidence in AI-supported operations.
What Mature Enterprises Measure Differently

As organizations progress from experimentation to large-scale deployment, their approach to measurement inevitably changes. The metrics that proved useful during early adoption often become insufficient once AI begins influencing multiple departments, operational processes, customer experiences, and strategic decisions.
This transition creates a dividing line between organizations that simply deploy AI and organizations that successfully govern AI over time.
Less mature enterprises typically focus on proving value.
More mature enterprises focus on understanding value.
The difference may appear subtle, but it fundamentally changes what gets measured, how decisions are evaluated, and how leadership interprets success.
Why Mature Organizations Expand Beyond Operational Metrics
Operational metrics remain important.
No organization should ignore:
- productivity improvements
- process acceleration
- cost efficiency
- workflow optimization
However, mature enterprises recognize that operational metrics describe only one layer of performance.
As AI becomes integrated into critical business functions, additional questions emerge:
- Is governance keeping pace with deployment?
- Are accountability structures still clear?
- Are oversight mechanisms functioning effectively?
- Is organizational resilience improving or declining?
- Are risks becoming easier or harder to identify?
These questions cannot be answered through productivity statistics alone.
They require broader measurement frameworks designed to evaluate organizational health alongside operational performance.
Why Measurement Must Evolve With Deployment Maturity
Strong measurement frameworks become far more valuable when they support sustainable AI oversight across increasingly complex enterprise environments.
One of the most common mistakes organizations make is assuming that measurement frameworks remain static.
In reality, measurement should evolve alongside deployment maturity.
During early adoption, organizations may focus primarily on:
- efficiency gains
- adoption rates
- implementation milestones
- operational improvements
As deployment expands, additional indicators become necessary.
Organizations increasingly need visibility into:
- governance participation
- escalation effectiveness
- accountability clarity
- exception management
- oversight consistency
Eventually, measurement frameworks must support strategic evaluation rather than operational validation.
The objective shifts from proving that AI works to understanding how AI affects the organization as a whole.
Why Mature Enterprises Balance Three Measurement Categories
The strongest AI measurement frameworks generally balance three categories.
1. Performance Metrics
Performance metrics help organizations understand operational outcomes.
Examples include:
- productivity
- efficiency
- throughput
- cost savings
- automation rates
These indicators explain whether AI is producing measurable operational value.
2. Governance Metrics
Governance metrics help organizations evaluate oversight quality.
Examples include:
- governance participation
- review completion rates
- policy adherence
- accountability clarity
- escalation responsiveness
These indicators help determine whether organizational controls remain effective as complexity increases.
3. Resilience Metrics
Resilience metrics help organizations understand long-term sustainability.
Examples include:
- exception resolution speed
- operational adaptability
- continuity performance
- organizational responsiveness
- oversight consistency
These indicators often reveal weaknesses long before traditional performance metrics begin showing signs of trouble.
Why Dashboards Should Reflect Organizational Reality
Many executive dashboards unintentionally create simplified versions of reality.
The objective is understandable.
Leaders need concise information.
Boards require efficient reporting.
Stakeholders expect clarity.
The challenge is that excessive simplification can create false confidence.
A dashboard showing:
- increasing productivity
- declining costs
- rising adoption
may appear highly positive.
Yet the same organization could simultaneously experience:
- declining governance participation
- increasing exception volumes
- slower escalation pathways
- weaker ownership clarity
If those indicators remain invisible, leadership receives only part of the picture.
Mature organizations increasingly design dashboards that balance operational performance with organizational health indicators.
This creates more realistic decision-making environments.
Why The Best Measurement Systems Support Better Decisions
Ultimately, measurement exists for one purpose.
Decision-making.
The value of a metric is not determined by how impressive it appears on a dashboard.
Its value is determined by whether it improves organizational understanding.
Strong measurement systems help leaders:
- allocate resources
- identify emerging risks
- strengthen governance
- improve accountability
- sustain performance
Weak measurement systems often create the illusion of understanding while leaving important conditions unexamined.
This distinction explains why organizations with similar technology can experience dramatically different outcomes.
The difference frequently lies not in what they deploy, but in what they choose to measure.
Why AI Success Is Ultimately An Organizational Outcome
The final lesson from enterprise AI measurement is that success rarely belongs to technology alone.
Technology contributes.
People contribute.
Processes contribute.
Governance contributes.
Leadership contributes.
When organizations attempt to measure AI success exclusively through technical or operational indicators, they often overlook the broader system responsible for producing outcomes.
AI success therefore becomes easier to understand when viewed as an organizational outcome rather than a technological outcome.
This perspective encourages more balanced measurement, stronger governance practices, clearer accountability structures, and more sustainable long-term deployment strategies.
Organizations that adopt this broader view generally develop a more accurate understanding of both performance and risk.
Over time, that understanding becomes a competitive advantage.
Conclusion
Measuring AI success appears straightforward during the early stages of deployment because efficiency improvements and productivity gains provide visible evidence of progress.
As deployments mature, measurement becomes significantly more complex.
Organizations must evaluate not only what AI produces, but also how AI influences governance, accountability, resilience, decision quality, customer outcomes, and long-term organizational performance.
The most successful enterprises recognize that operational metrics alone cannot explain sustainable success.
They expand their measurement frameworks to include governance indicators, accountability measures, escalation effectiveness, oversight consistency, and resilience factors that reveal emerging conditions before visible outcomes appear.
This shift allows leadership teams to move beyond activity measurement and toward organizational understanding.
In the long run, organizations that measure broadly tend to govern more effectively, identify risks earlier, and sustain AI deployment more successfully than organizations that focus exclusively on productivity.
The challenge is not collecting more data.
The challenge is measuring the conditions that truly shape future outcomes.
FAQ
Why is measuring AI success difficult?
Measuring AI success is difficult because productivity and efficiency metrics often capture only part of the overall impact. Governance quality, accountability, resilience, customer outcomes, and long-term organizational effects are often harder to measure.
Are productivity gains enough to prove AI success?
Not always. Productivity gains may demonstrate operational improvement, but they do not necessarily reflect governance maturity, risk exposure, accountability clarity, or long-term organizational sustainability.
What are leading indicators in AI measurement?
Leading indicators help identify future conditions before outcomes become visible. Examples include governance participation, ownership clarity, escalation effectiveness, exception management, and oversight consistency.
Why do organizations misread positive AI results?
Organizations often focus on productivity, adoption, and efficiency metrics while overlooking governance, accountability, and risk indicators. This can create a misleading impression of overall success.
What do mature enterprises measure differently?
Mature enterprises balance operational metrics with governance, accountability, resilience, oversight, and long-term sustainability indicators to gain a more complete view of AI performance.