

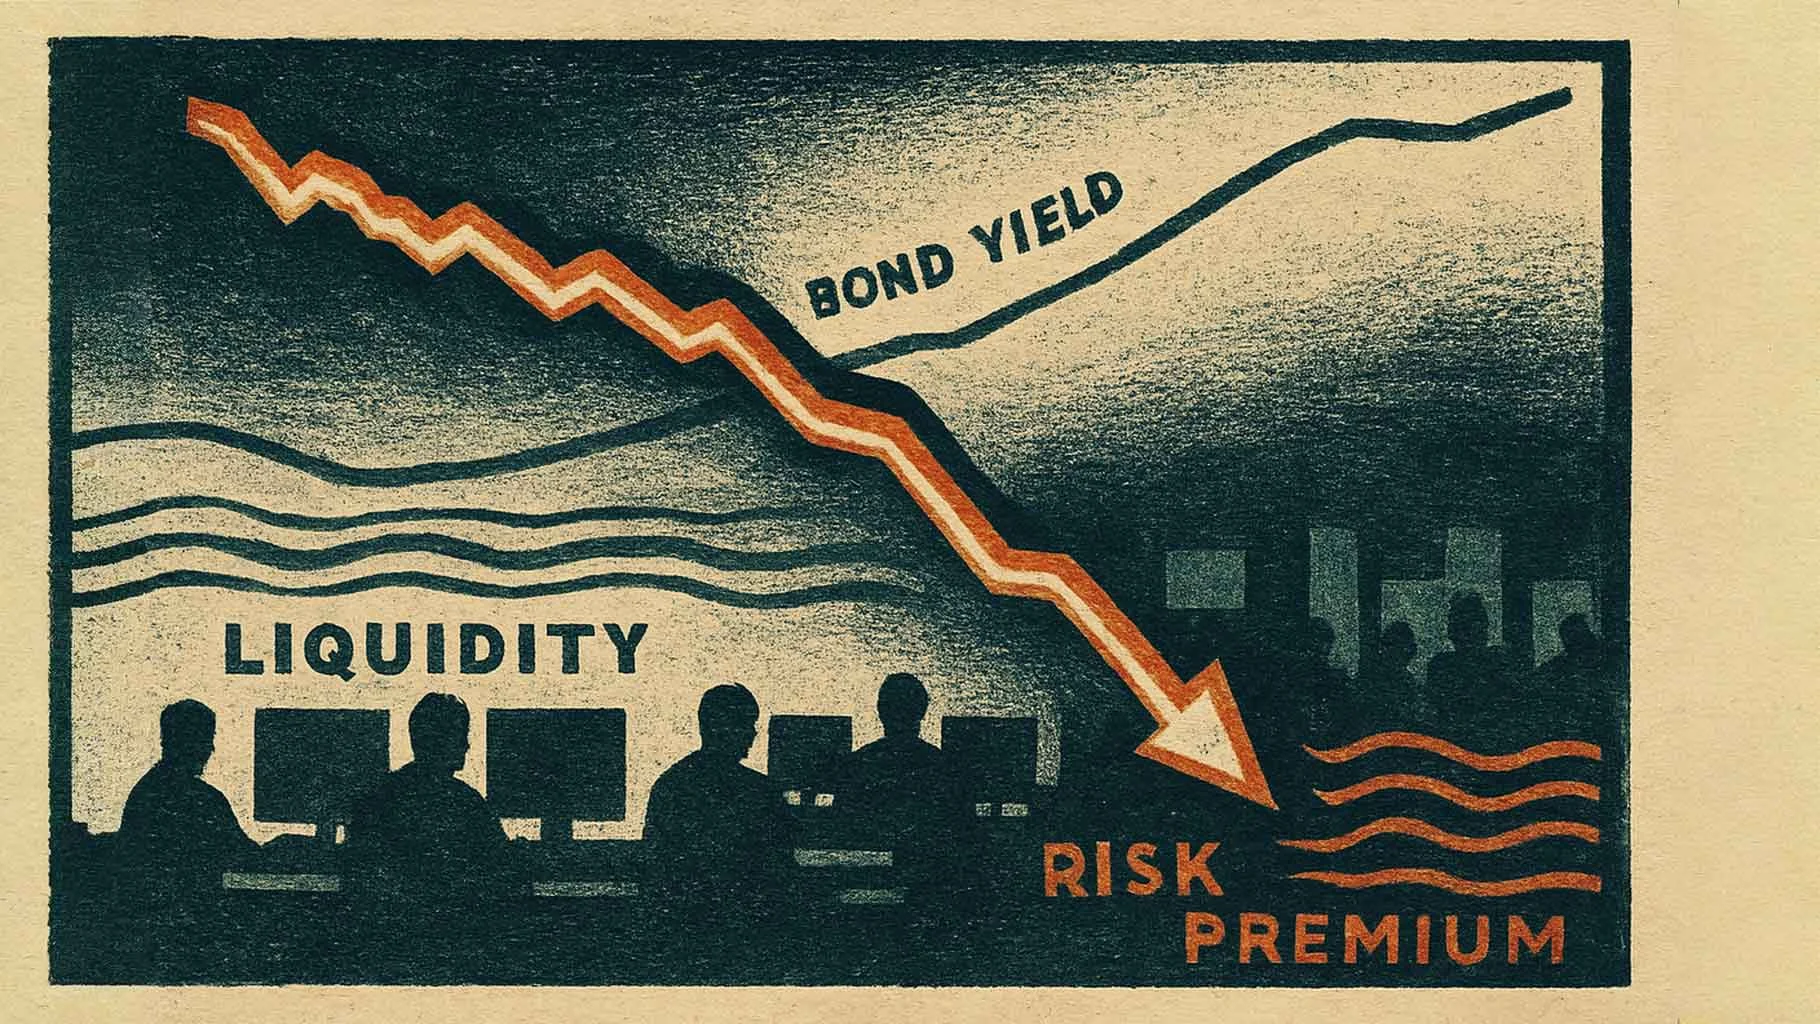

Editorial Disclosure & Analysis Notice
This article provides structural market analysis based on macroeconomic principles, valuation frameworks, and liquidity mechanics. It does not provide investment recommendations or individualized financial advice. Financial markets involve risk, and valuation dynamics discussed here reflect general mechanisms observed across global equity markets.
All interpretations are educational in nature and designed to explain systemic behavior rather than forecast specific asset outcomes.
The Sudden Drop That Looks Irrational
A company reports strong earnings. Revenue rises. Margins expand. Future guidance appears stable. Analysts maintain optimistic projections. And yet, within hours, the share price falls 15 percent.
To retail investors, this looks irrational. To institutional traders, it looks mechanical.
This gap in perception is not accidental. It exists because shares do not move primarily on what happened. They move on how the market recalculates future value under changing financial conditions.
Understanding why shares reprice violently requires stepping away from headlines and examining structural forces – interest rates, liquidity flows, capital costs, valuation compression, duration sensitivity, and forced selling dynamics.
Most retail participants interpret price changes through narrative. Professional markets operate through repricing equations.
The difference between those two lenses explains why investors repeatedly misread market behavior.
Shares Are Discounted Claims on Future Cash Flows
To understand how interest rates affect stocks, it is necessary to examine the discount rate embedded within equity valuation models.
A share is not a reflection of current profit. It is a financial instrument representing discounted expectations of future cash flows.
When investors buy shares, they are implicitly agreeing to a valuation model:
Future earnings → discounted back to present value → adjusted for risk.
The discount rate used in that equation is not static. It changes with macroeconomic conditions – particularly interest rates.
When central banks adjust policy rates, the ripple effect extends beyond bonds. It alters how every future corporate dollar is valued.
If the discount rate rises, future earnings are worth less today. If it falls, future earnings are worth more.
This mechanism is simple in formula but profound in impact.
Even if a company’s operations remain stable, its valuation can compress solely because the rate environment changed.
That is why shares can fall during periods of strong earnings growth. The denominator in the valuation equation moved.
The Role of Interest Rates in Repricing
Interest rates serve as the foundational cost of capital across the financial system.
They influence:
- Borrowing costs for corporations
- Required return expectations for investors
- Bond yields competing with equity returns
- Risk premium recalculations
When government bond yields rise, equities must offer higher expected returns to remain attractive. That means valuations adjust downward.
The mechanism works through several channels:
- Higher rates increase corporate interest expenses.
- Higher bond yields provide alternative safe returns.
- Institutional models adjust required equity risk premiums.
- Discounted cash flow projections compress.
Retail investors often focus on company-specific developments. Institutions evaluate macro discount conditions first.
This structural difference creates perception gaps during volatile periods.
Why Growth Shares Fall Harder
Not all shares respond equally to rate changes.
Growth shares – companies expected to produce significant earnings far in the future – behave like long-duration assets.
Duration, in financial terms, measures sensitivity to interest rate changes.
The further in the future expected cash flows occur, the more sensitive valuation becomes to changes in discount rates.
When rates rise:
- Near-term cash flow companies experience modest compression.
- Long-duration growth companies experience disproportionate repricing.
This is not punishment. It is mathematics.
The larger the distance between present and projected profit realization, the greater the impact of discount rate shifts.
This explains why technology-heavy indices often underperform sharply during tightening cycles.
It is not about the company failing. It is about valuation recalibration.
Liquidity – The Invisible Accelerator
Interest rates adjust valuation logic. Liquidity amplifies price movement.
Liquidity represents the ease with which assets can be bought or sold without causing significant price movement.
During periods of abundant liquidity:
- Credit is cheap.
- Leverage expands.
- Risk tolerance increases.
- Valuation multiples stretch.
When liquidity tightens:
- Margin borrowing contracts.
- Hedge funds reduce leverage.
- Risk assets face systematic selling pressure.
- Multiples compress.
The relationship between liquidity and shares is nonlinear. Tightening liquidity can trigger feedback loops.
As prices fall:
- Margin calls increase.
- Forced selling accelerates.
- Volatility spikes.
- Risk models reduce exposure further.
This cascade effect is often mistaken for panic.
In reality, it is mechanical de-leveraging.
Understanding liquidity mechanics is critical to understanding violent repricing.
Why Retail Investors Misinterpret Repricing
Retail investors typically analyze events in isolation:
- Earnings beat or miss.
- Product launch success.
- CEO statement.
- Analyst upgrade or downgrade.
Institutional desks operate within a different framework:
- Macro rate cycle.
- Credit spreads.
- Liquidity conditions.
- Risk appetite models.
- Portfolio rebalancing constraints.
When these frameworks collide, retail participants see randomness where professionals see systematic repricing.
This perception mismatch explains common behavioral patterns:
- Buying at market peaks during liquidity expansions.
- Panic selling during mechanical de-leveraging.
- Misreading rate cycle transitions.
- Confusing valuation compression with business failure.
The misunderstanding is structural, not emotional.
The Illusion of “Good Company = Good Stock”
One of the most persistent misconceptions in equity markets is the assumption that strong companies automatically produce strong share performance.
Company quality and share valuation are related but distinct variables.
A strong company can become an overvalued asset.
A stable business can decline in price without operational deterioration.
A profitable enterprise can experience valuation collapse during macro repricing.
The market prices expectations, not achievements.
When expectations are elevated and discount rates shift upward, repricing becomes abrupt.
This is why some of the largest drawdowns occur in companies that continue reporting positive earnings growth.
The market is not disagreeing with performance. It is disagreeing with valuation.
Structural Risk vs Narrative Risk
Narrative risk refers to news-driven events – lawsuits, regulatory changes, product failures.
Structural risk refers to systemic forces – interest rate changes, liquidity contraction, capital reallocation.
Structural forces typically overpower narrative developments during macro transitions.
Investors who focus only on headlines often underestimate structural repricing risk.
The market does not need a dramatic news event to fall. It needs a recalibrated discount rate.
Understanding this distinction reduces the illusion of randomness.
Why Repricing Feels Violent
Shares do not adjust smoothly when structural conditions change. They gap.
That is because markets price forward expectations in real time.
If rate expectations shift within days due to inflation data, policy statements, or bond market movements, valuation models update instantly.
This creates:
- Rapid multiple compression.
- Sector rotation.
- Portfolio de-risking.
- Increased volatility clustering.
From a structural perspective, this is efficient repricing.
From a retail perspective, it feels abrupt and unfair.
The difference lies in understanding how forward pricing works.
The Beginning of a Deeper Mechanism
So far, we have examined three foundational forces:
- Discount rate shifts.
- Duration sensitivity.
- Liquidity contraction.
In the next section, we will examine:
- Equity risk premiums.
- Valuation compression mathematics.
- Feedback loops in bear markets.
- Why dividend shares are not immune.
- How margin systems accelerate declines.
- And how structural cycles repeat globally.
This is where the full mechanism reveals itself.
Scope Clarification
The mechanisms discussed throughout this article describe historical and structural relationships observed across global markets. Market behavior can vary depending on geopolitical conditions, regulatory environments, and policy shifts. The purpose of this analysis is explanatory rather than predictive.
Equity Risk Premium – The Hidden Variable Behind Every Share Price
The equity risk premium represents the additional return investors demand for holding equities instead of risk-free government bonds.
Interest rates are only one side of the valuation equation. The second variable that determines how shares reprice is the equity risk premium. The equity risk premium represents the additional return investors demand for holding equities instead of risk-free government bonds. It reflects compensation for uncertainty, volatility, drawdowns, and structural economic risk. When markets reprice violently, it is often not just because interest rates changed, but because the required risk premium expanded simultaneously.
If a 10-year government bond yields 3 percent and investors demand a 5 percent equity risk premium, the required return for equities becomes 8 percent. If uncertainty rises and the equity risk premium increases to 6.5 percent while bond yields remain constant, the required return becomes 9.5 percent. That increase alone compresses valuation multiples even if corporate earnings remain stable.
The equity risk premium expands during periods of stress, policy tightening, geopolitical uncertainty, or liquidity contraction. It compresses during periods of optimism, strong liquidity conditions, and stable macro expectations. Shares move not only because earnings change, but because required returns fluctuate.
Understanding this dynamic explains why markets often decline before recessions officially begin. The risk premium expands in anticipation of uncertainty. Prices adjust before economic data confirms deterioration.
Valuation Compression Mathematics – Why Multiples Fall Faster Than Earnings
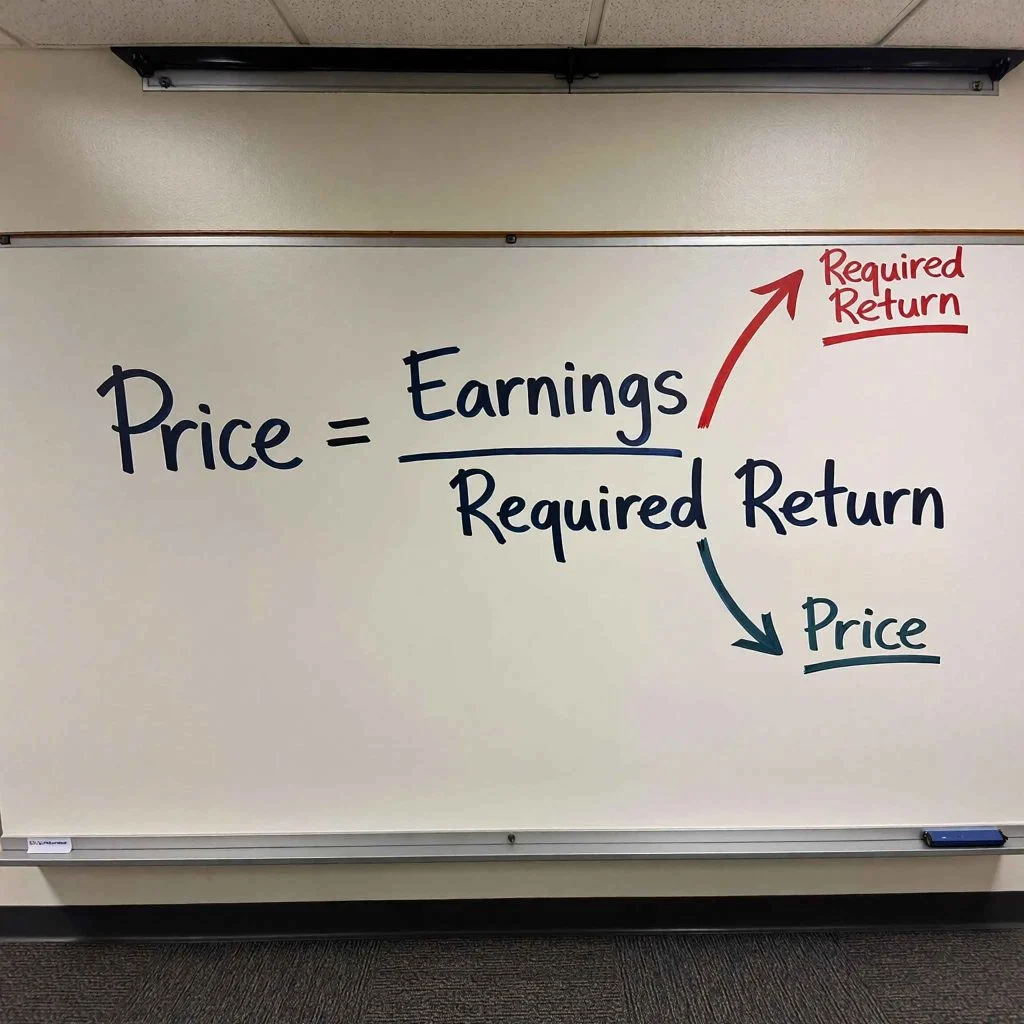
Valuation compression occurs when the price-to-earnings multiple declines due to changes in required return expectations. The price of a share can be simplified as:
Price = Expected Earnings / Required Return
If expected earnings remain constant but the required return rises, price must fall.
For example:
Expected earnings per share = 10
Required return = 8 percent
Implied valuation = 125
If required return rises to 10 percent while earnings remain 10, valuation falls to 100. That represents a 20 percent decline without any operational deterioration.
This mathematical compression explains why strong companies can experience severe drawdowns during rate tightening cycles. The denominator in the valuation equation changes faster than earnings can adjust.
Retail investors often focus on numerator changes – earnings growth, revenue expansion, margin improvement. Institutional desks monitor denominator risk – discount rate shifts and risk premium expansion.
In tightening environments, denominator risk dominates.
Duration Sensitivity – Why Growth Shares React Exponentially

Duration measures how sensitive an asset’s valuation is to changes in interest rates. In bond markets, duration quantifies price sensitivity to yield changes. In equity markets, duration approximates how far into the future earnings are expected to materialize.
Companies with near-term stable cash flows exhibit shorter duration. Companies whose profitability depends on distant future growth exhibit longer duration.
When required returns increase by 1 percent:
- Short-duration shares may decline modestly.
- Long-duration growth shares may decline disproportionately.
This is not a commentary on business quality. It is a function of discounted cash flow mathematics.
Technology-heavy indices frequently exhibit long-duration characteristics. When interest rates rise, these sectors experience accelerated repricing due to amplified duration exposure.
Duration explains why growth-led bull markets often reverse sharply during tightening phases.
The following structural model illustrates how projection horizon and required return shifts interact to amplify duration sensitivity in growth-oriented shares.
Duration Sensitivity Calculator
Estimates valuation sensitivity based on projected growth horizon and required return changes. Structural illustration only.
Dividend Yield Illusion During Tightening Cycles
Dividend-paying shares are often perceived as defensive. However, dividend yields themselves are influenced by required return adjustments.
Dividend yield equals dividend per share divided by price. When required returns rise, prices fall until yields reflect higher risk compensation.
If a dividend share yields 4 percent in a low-rate environment and bond yields rise from 2 percent to 4 percent, investors demand a higher spread above bonds. The dividend share must reprice downward until its yield rises sufficiently to compensate for additional risk.
This mechanism explains the structural dividend yield risk during aggressive tightening cycles.
The dividend itself may remain unchanged. The yield adjusts through price compression.
Liquidity Feedback Loops – The Acceleration Mechanism
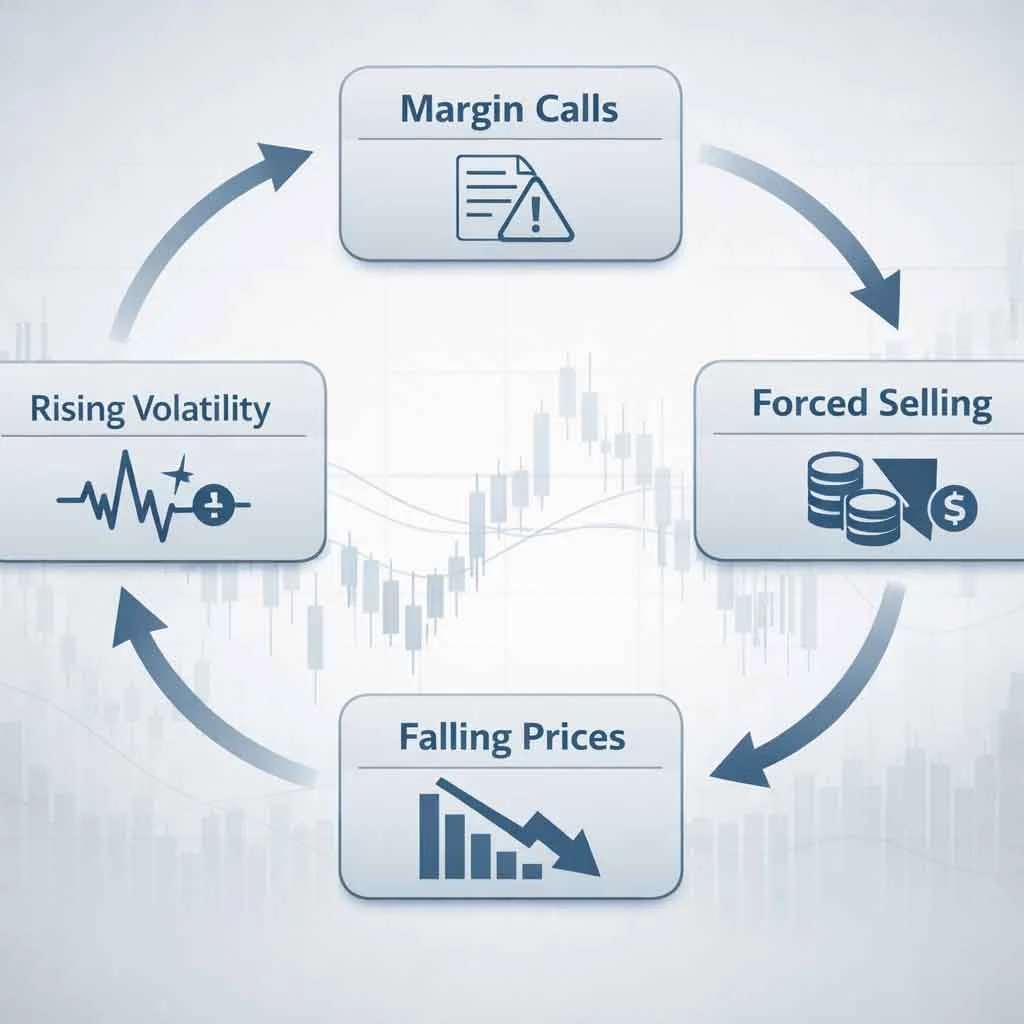
Valuation compression alone does not create violent market moves. Liquidity feedback loops amplify them.
In leveraged environments:
- Hedge funds borrow to increase exposure.
- Margin accounts amplify retail positioning.
- Derivatives magnify directional bets.
When asset prices decline due to required return expansion:
- Margin requirements increase.
- Collateral values fall.
- Forced selling emerges.
Forced selling drives prices lower, which triggers additional margin calls. This loop creates nonlinear price declines.
Liquidity contraction therefore acts as an accelerator rather than a root cause.
The following simulation demonstrates how an initial market decline can intensify when margin amplification and liquidity contraction interact simultaneously.
Liquidity Stress Visualizer
Demonstrates how margin amplification and liquidity contraction accelerate drawdowns.
Interest rate changes adjust valuation logic. Liquidity conditions determine speed and magnitude.
Capital Reallocation Across Asset Classes
Equity repricing is also influenced by cross-asset competition. When government bond yields rise meaningfully, institutional capital rotates.
Pension funds, insurance companies, and sovereign wealth funds allocate capital based on risk-adjusted return targets. If bonds begin offering higher yields with lower volatility, allocation models shift.
This reallocation reduces marginal demand for equities. Lower demand pressures valuations downward until expected equity returns realign with required institutional targets.
Shares do not operate in isolation. They compete within a global capital allocation system.
Global Transmission – Why Structural Cycles Repeat
Structural repricing cycles repeat globally because the core drivers are universal:
- Interest rate policy shifts
- Liquidity expansions and contractions
- Risk premium fluctuations
- Cross-asset capital rotation
Whether in the United States, Europe, Asia, or emerging markets, these mechanisms function similarly. Local regulatory differences may influence magnitude, but the foundational repricing structure remains consistent.
This universality explains why synchronized global drawdowns occur during tightening cycles and synchronized rallies occur during easing cycles.
Introducing the Rate Shock Impact Model
To understand how small shifts in required return influence valuation, consider a simplified rate shock scenario.
If a share trades at 20 times earnings under a required return of 8 percent, and the required return increases to 9 percent, the implied multiple falls to approximately 18 times earnings. If it increases to 10 percent, the implied multiple falls closer to 16 times earnings.
Small changes in required return can therefore produce double-digit percentage declines.
In the next section, we will formalize this relationship through structured modeling and introduce a practical framework that demonstrates how rate shifts cascade through valuation systems.
We will examine:
- Multi-year cash flow discounting
- Terminal value sensitivity
- Nonlinear duration exposure
- Why late-cycle optimism magnifies downside
- How structural repricing precedes economic data
The mechanism becomes clearer when modeled step by step.
Multi-Year Discounted Cash Flow Sensitivity – Where Small Assumptions Create Large Outcomes
To understand why shares can reprice violently even when earnings growth appears stable, the full discounted cash flow structure must be examined rather than simplified price-to-earnings relationships. While the earlier equation illustrated compression mechanics conceptually, real-world equity valuation extends across multi-year projections, terminal value assumptions, and compounding discount adjustments.
A simplified multi-year discounted cash flow framework looks like this:
Present Value = Sum of (Future Cash Flow / (1 + Required Return)^t) + Terminal Value Component
Each year’s projected cash flow is discounted by the required return raised to the power of time. The further into the future the cash flow occurs, the more sensitive it becomes to required return changes.
Consider a company expected to generate the following free cash flows:
Year 1: 5
Year 2: 6
Year 3: 7
Year 4: 8
Year 5: 9
Under an 8 percent required return, the discounted value of these flows produces a valuation baseline. If the required return increases to 9.5 percent, every projected year is discounted more aggressively, and the cumulative present value declines meaningfully.
The longer the forecast horizon, the greater the compression.
Growth-oriented companies typically derive a significant portion of valuation from years beyond the initial forecast window. This introduces another layer of sensitivity: terminal value.
Terminal Value Sensitivity – The Silent Driver of Volatility
Terminal value represents the estimated value of all future cash flows beyond the explicit projection period. In many valuation models, terminal value accounts for more than half of the total calculated share price.
Terminal value is often calculated as:
Terminal Value = Final Year Cash Flow × (1 + Growth Rate) / (Required Return – Growth Rate)
This formula reveals a structural vulnerability.
If required return increases while growth expectations remain constant, the denominator widens. As the denominator widens, terminal value declines disproportionately.
For example:
Final Year Cash Flow = 9
Growth Rate = 3 percent
Required Return = 8 percent
Terminal Value ≈ 9 × 1.03 / (0.08 – 0.03)
If required return rises to 9 percent, the denominator changes from 5 percent to 6 percent. That small adjustment produces a significant reduction in terminal value.
Because terminal value dominates many growth share valuations, slight changes in rate assumptions can create dramatic repricing.
This is why late-cycle growth enthusiasm often masks structural fragility. When rates are stable or declining, terminal values expand. When rate direction reverses, compression accelerates.
Nonlinear Duration Exposure – Why Downside Accelerates
Duration sensitivity in equities is not linear.
When required return increases from 8 percent to 8.5 percent, the effect may appear moderate. However, when increases accumulate from 8 percent to 10 percent, compounding discount adjustments create nonlinear effects.
Each percentage increase compounds across multi-year projections and terminal calculations simultaneously. The longer the growth runway assumed in the model, the steeper the nonlinear compression curve.
This explains why equity markets often decline gradually at first during tightening cycles and then accelerate sharply as rate expectations continue rising.
Markets initially adjust modestly. As models are recalibrated repeatedly, compression compounds.
Nonlinearity transforms gradual macro shifts into abrupt valuation resets.
Late-Cycle Optimism – When Expectations Magnify Fragility
Late-stage bull markets often exhibit elevated growth assumptions embedded in valuation models.
Projected revenue expansion rates extend further into the future. Margins are assumed to remain stable or expand. Terminal growth rates are modeled optimistically.
Under stable or falling rates, these assumptions sustain high multiples.
However, when the macro cycle shifts and required returns rise, optimistic assumptions amplify downside sensitivity. Elevated terminal growth expectations become mathematically unstable when paired with rising discount rates.
The greater the optimism embedded in models, the greater the vulnerability when discount conditions change.
Repricing is not random. It reflects tension between expectation intensity and required return stability.
Structural Repricing Precedes Economic Confirmation
Markets operate on forward expectations, not trailing data.
When inflation accelerates, central bank communication shifts, or bond yields begin trending upward, equity models adjust before economic reports confirm slowdown.
By the time earnings decline appears in quarterly reports, valuation compression has often already occurred.
This sequencing explains a common phenomenon:
Economic data appears stable while shares decline.
Later, economic data weakens.
Finally, markets stabilize before economic data improves.
Equity markets discount future conditions ahead of confirmation.
Understanding this sequence reduces the illusion that markets move irrationally. They move preemptively.
Modeling a Rate Shock Scenario – A Practical Framework
Consider a share priced at 150 with expected earnings of 10 growing at 6 percent annually for five years, with a terminal growth rate of 3 percent.
Under an 8 percent required return, valuation may justify that 150 price level.
If macro conditions shift and required return rises to 9.5 percent:
- Discounted future earnings decline.
- Terminal value contracts.
- Equity risk premium expansion compounds compression.
- Liquidity tightening may accelerate price movement.
Even without earnings deterioration, valuation may fall to 120 or below depending on model sensitivity.
That decline may appear disconnected from company performance. Structurally, it reflects denominator expansion.
This modeling framework forms the foundation of a Rate Shock Impact approach.
In practice, institutional analysts continuously adjust required return assumptions across portfolios. These adjustments occur simultaneously across thousands of shares.
When repricing is synchronized, market-wide volatility emerges.
Rate Shock Impact Simulator
This tool illustrates how small changes in required return can compress valuation multiples, even when earnings assumptions stay constant. Inputs reflect structural sensitivity, not forecasts.
Rate Shock Impact Simulator
This structural model illustrates how changes in required return influence valuation compression. It does not provide investment advice or price forecasts.
The Role of Margin Systems in Late-Stage Acceleration
As repricing unfolds, margin systems amplify structural adjustments.
During bullish expansions, leverage builds gradually. Retail margin borrowing rises. Hedge funds increase exposure through derivatives. Risk parity strategies expand positions under low volatility conditions.
When volatility rises and valuations compress:
- Risk models reduce exposure automatically.
- Margin calls force liquidation.
- Volatility targeting strategies unwind positions.
- Liquidity thins.
This dynamic creates a second wave of repricing independent of fundamentals.
Structural repricing begins with discount rate shifts. Liquidity feedback then magnifies magnitude.
Why Structural Cycles Appear Repetitive
Across decades, similar patterns repeat:
- Rate easing fuels valuation expansion.
- Liquidity abundance supports leverage growth.
- Risk premiums compress.
- Optimism embeds into long-duration assets.
- Policy shifts trigger required return expansion.
- Valuation compression begins.
- Liquidity contraction accelerates downside.
- Risk premiums overshoot.
- Stabilization emerges as expectations reset.
These cycles are not identical, but the structural architecture remains consistent.
Global markets share this architecture because capital allocation systems share foundational valuation logic.
Behavioral Misinterpretation – Why Structural Repricing Feels Personal
Structural repricing is mathematical. Behavioral reaction is human. When the two intersect, misunderstanding becomes widespread.
Retail investors typically interpret market movement through narrative framing. A price decline is attributed to news. A rally is attributed to optimism. Volatility is attributed to fear. Yet in many cases, price movement precedes narrative explanation rather than follows it.
When required returns increase and valuation models compress, the adjustment is mechanical. However, the absence of visible deterioration in company performance creates cognitive dissonance. Investors search for justification. Media narratives often provide one retroactively.
This sequence fosters a perception that markets are irrational or manipulated. In reality, repricing reflects structural recalibration.
Behavioral discomfort arises because the mechanism operates invisibly. Required return assumptions do not appear in quarterly earnings releases. Liquidity contraction is not announced in headline form. Margin unwinds occur silently across portfolios.
The structural layer remains hidden while the price layer is visible.
The Illusion of “Strong Earnings Protection”
A common belief among retail participants is that strong earnings protect shares from major declines. While earnings growth influences long-term valuation, short-term repricing often responds more aggressively to discount rate shifts.
When interest rates rise or risk premiums expand, even accelerating earnings growth can be insufficient to offset denominator compression. Investors anchored to operational strength may underestimate macro sensitivity.
This anchoring effect leads to a recurring pattern. Retail participants add exposure during early compression phases, believing price weakness is unjustified. As structural repricing deepens, forced selling or emotional capitulation emerges.
The market does not penalize company quality. It recalibrates valuation assumptions.
Buying Strength at the End of Cycles
Late-stage bull markets often exhibit a psychological shift from skepticism to consensus confidence. Extended periods of liquidity support reinforce the perception that structural risk is minimal. Valuation multiples expand gradually and then rapidly.
As prices rise, confirmation bias strengthens. Positive earnings reinforce upward momentum. Capital flows increase as performance attracts attention. Retail inflows often peak near late-cycle stages because strong historical returns reduce perceived risk.
When policy conditions shift and required returns begin rising, initial declines are interpreted as temporary pullbacks. Structural compression continues beneath the surface.
The behavioral lag between structural shift and psychological recognition explains why retail participation often increases near valuation peaks.
This is not an indictment of retail behavior. It reflects natural extrapolation bias in trending environments.
Panic Selling During Denominator Expansion
As repricing accelerates, volatility increases. Portfolio values decline. Margin systems amplify downside. Media narratives shift from optimism to concern.
At this stage, investors who initially anchored to earnings strength encounter rising uncertainty. The denominator expansion that began mechanically now intersects with emotional response.
Panic selling often emerges after significant compression has already occurred. Forced selling from leveraged participants may precede emotional selling from unleveraged participants.
The distinction matters.
Structural repricing initiates adjustment. Emotional reaction amplifies volatility at later stages.
Understanding this sequencing reduces the perception that declines are purely psychological events. Emotion follows structure more often than it creates it.
Structural Disadvantage vs Emotional Reaction
Retail investors face structural disadvantages independent of emotion. Institutional desks continuously monitor:
- Bond yield shifts
- Derivatives positioning
- Cross-asset correlations
- Funding conditions
- Liquidity metrics
- Risk parity exposure
These variables adjust valuation models dynamically.
Retail participants often lack real-time integration of these metrics. As a result, repricing appears sudden rather than progressive.
Structural disadvantage does not imply inevitability of underperformance. It reflects asymmetry in information flow and model recalibration speed.
The perception that markets move unpredictably often stems from limited visibility into structural recalculation processes.
Narrative Construction After Price Movement
Financial media frequently attributes price movement to discrete causes: a policy speech, an earnings comment, a geopolitical headline. While such events influence sentiment, they often coincide with deeper structural adjustments already underway.
For example, bond yields may trend upward for weeks before equity markets accelerate downward. The eventual equity decline is then linked to a headline event, though the denominator expansion had been building gradually.
Narrative framing simplifies complex repricing dynamics into accessible explanations. However, simplicity can obscure mechanism.
Investors interpreting markets primarily through narrative risk misidentifying structural inflection points.
Overconfidence During Liquidity Expansion
Liquidity expansion phases compress equity risk premiums and lower required returns. Valuation multiples expand. Volatility declines. Leverage increases.
These conditions reinforce confidence. Reduced volatility creates the illusion of reduced risk. Performance consistency strengthens belief in trend persistence.
When volatility re-emerges during tightening cycles, the psychological contrast feels extreme. Yet the volatility is not new. It reflects reversion from compressed risk pricing to normalized risk compensation.
Confidence built during liquidity abundance can magnify shock when structural repricing begins.
Why Structural Cycles Persist Across Generations
Despite widespread historical evidence of rate cycles and liquidity transitions, behavioral patterns remain consistent.
New participants enter markets during expansion phases. Institutional memory fades as volatility recedes. Structural risk appears theoretical rather than immediate.
When repricing occurs, it is experienced as unprecedented even though similar cycles have unfolded repeatedly.
The persistence of behavioral misinterpretation reinforces structural cycle repetition.
Markets are forward-discounting systems operating within human psychology.
Integrating Structure and Behavior
Structural forces determine valuation boundaries. Behavioral responses influence short-term volatility around those boundaries.
Interest rate shifts expand required returns. Liquidity contraction accelerates compression. Equity risk premiums widen. Duration sensitivity amplifies downside. Margin systems intensify movement.
Behavioral interpretation overlays this structure with narrative, anchoring, overconfidence, and capitulation.
Understanding repricing requires integrating both layers.
Ignoring structure leads to misreading price movement. Ignoring behavior underestimates volatility amplitude.
The Complete Repricing Framework – How Structural Cycles Unfold
Equity markets do not reprice randomly. They transition through identifiable structural phases. While each cycle differs in magnitude and duration, the underlying architecture remains consistent.
The complete repricing framework can be understood in five broad phases:
- Liquidity Expansion
- Risk Premium Compression
- Duration Extension
- Required Return Expansion
- Liquidity Contraction and Stabilization
These phases overlap rather than occur in isolation, but the sequencing provides structural clarity.
Phase One – Liquidity Expansion
Liquidity expansion typically begins during or after economic stress. Central banks reduce policy rates. Bond yields decline. Funding conditions ease. Credit spreads compress.
Lower rates reduce the required return for equities. Discount rates decline. Valuation multiples expand even before earnings growth accelerates.
During this phase:
- Equity risk premiums compress.
- Volatility declines.
- Leverage gradually increases.
- Growth shares outperform due to duration sensitivity.
Expansion often feels stable and predictable. Valuation expansion is attributed to optimism, though structurally it reflects denominator compression.
Phase Two – Risk Premium Compression
As markets stabilize, risk premiums compress further. Investors demand less compensation for uncertainty. Asset prices rise relative to earnings growth.
Confidence strengthens. Capital flows increase. Retail participation rises as prior volatility fades from memory.
During this stage:
- Long-duration assets lead performance.
- Multiples expand faster than earnings grow.
- Valuation dispersion narrows.
- Narrative optimism reinforces structural expansion.
Risk premium compression magnifies duration exposure, embedding vulnerability beneath surface stability.
Phase Three – Duration Extension
As valuations stretch, future growth assumptions extend further into projection models. Terminal value weight increases within discounted cash flow structures.
Duration exposure intensifies across portfolios.
Late-cycle optimism often embeds elevated long-term growth assumptions. Marginal improvements in earnings expectations support disproportionately large valuation expansions.
This stage appears strongest immediately before structural inflection.
Phase Four – Required Return Expansion
Inflection occurs when macro conditions shift. Inflation rises. Policy communication changes. Bond yields trend upward. Liquidity growth slows.
Required returns begin rising incrementally. Early compression appears modest.
As rate expectations continue adjusting:
- Discount rates increase.
- Equity risk premiums widen.
- Terminal values compress.
- Growth shares decline disproportionately.
This phase often begins before economic deterioration appears in official data.
Structural repricing leads economic confirmation.
Phase Five – Liquidity Contraction and Stabilization
If tightening persists or uncertainty expands, liquidity contracts meaningfully. Margin systems activate. Volatility rises.
Feedback loops accelerate repricing.
Eventually:
- Risk premiums overshoot.
- Valuation compression stabilizes.
- Leverage unwinds.
- Required returns plateau.
Stabilization emerges not because conditions are strong, but because expectations reset.
The cycle then prepares for eventual liquidity normalization.
Cross-Asset Interaction – Bonds, Credit, and Equities
Equities cannot be analyzed independently of bonds and credit markets.
Government bond yields influence base discount rates. Corporate credit spreads reflect perceived default risk. Credit tightening often precedes equity volatility spikes.
When credit spreads widen:
- Required returns increase beyond base rate changes.
- Equity risk premiums expand further.
- Capital allocation shifts toward defensive assets.
This cross-asset interaction reinforces structural repricing.
Equity declines often accelerate when bond volatility increases simultaneously.
Global Synchronization
Modern capital markets are interconnected. Global sovereign yields influence domestic valuation models. Cross-border capital flows adjust rapidly.
When major economies tighten policy simultaneously:
- Global required returns rise.
- Emerging market capital outflows accelerate.
- Currency volatility increases.
- Equity repricing synchronizes across regions.
Global synchronization amplifies magnitude but does not alter structure.
Structural Signals That Precede Volatility
While no indicator predicts exact timing, structural transitions often coincide with:
- Sustained upward trends in long-term bond yields.
- Gradual widening of corporate credit spreads.
- Rising volatility in currency markets.
- Increased dispersion between value and growth performance.
- Deterioration in liquidity-sensitive sectors.
These signals reflect denominator pressure building before headline recognition.
Why Repricing Appears Sudden
Repricing appears sudden because markets adjust forward expectations in real time.
Gradual yield increases accumulate quietly. Then a threshold is reached where model recalibration accelerates.
When required return assumptions change simultaneously across institutions, repricing becomes visible rapidly.
From inside valuation systems, the adjustment is progressive. From outside, it appears abrupt.
Integrating Structure with Discipline
Understanding structural cycles does not eliminate volatility. It clarifies context.
Interest rate shifts influence required returns.
Required returns influence valuation multiples.
Liquidity conditions influence speed.
Risk premiums influence amplitude.
Behavioral responses influence short-term extremes.
Together, these elements form a repeatable architecture.
Structural Repricing Checklist – A Consolidated Analytical Framework
Equity repricing can be interpreted through a structured lens rather than through isolated narratives. The framework below consolidates the mechanisms discussed throughout this article into a repeatable architecture.
When evaluating major share price movements, the following structural dimensions typically interact simultaneously:
- Base Interest Rate Direction
- Equity Risk Premium Movement
- Duration Exposure Concentration
- Liquidity Conditions
- Leverage and Margin Sensitivity
- Cross-Asset Capital Reallocation
- Behavioral Lag Effects
Each dimension influences required return assumptions either directly or indirectly.
Base Interest Rate Direction
Sustained shifts in long-term government bond yields alter discount rate baselines. Even incremental upward movements, when persistent, increase required returns embedded within valuation models.
The speed of repricing often depends less on the magnitude of rate changes and more on the trajectory. A steady upward trend introduces denominator pressure even if absolute levels remain historically moderate.
Equities reprice not because rates are “high,” but because rate direction changes.
Equity Risk Premium Expansion
The equity risk premium adjusts dynamically based on perceived uncertainty, macro instability, and volatility expectations.
Risk premium expansion often occurs before visible economic deterioration. Institutional allocation models demand higher compensation for uncertainty when forward visibility declines.
Because the risk premium compounds on top of base rate adjustments, its expansion frequently magnifies valuation compression beyond what rate changes alone would imply.
Duration Exposure Concentration
Markets heavily weighted toward long-duration growth assets exhibit amplified sensitivity to required return shifts.
If large index components derive substantial valuation from distant projected cash flows, aggregate market sensitivity increases.
Duration concentration transforms modest discount rate increases into broad index-level compression.
This explains why growth-heavy cycles tend to experience sharper structural resets.
Liquidity Conditions
Liquidity acts as a force multiplier.
Abundant liquidity compresses risk premiums and supports leverage expansion. Tight liquidity reverses both effects.
When funding costs rise or credit availability contracts, valuation compression accelerates through forced deleveraging rather than through gradual repricing alone.
Liquidity does not initiate denominator expansion, but it accelerates its impact.
Leverage and Margin Sensitivity
Leverage introduces nonlinear dynamics.
During expansion phases, leverage builds quietly. When volatility increases and valuations decline, margin thresholds activate.
Margin unwinds create price-insensitive selling pressure, intensifying repricing.
This secondary wave often generates the most visible volatility, though the structural compression began earlier.
Cross-Asset Capital Reallocation
Capital allocation models compare equities against bonds, credit, and alternative assets.
When risk-free yields rise meaningfully, institutional capital rebalances portfolios to maintain target return thresholds.
This reallocation reduces marginal equity demand until expected equity returns realign with institutional objectives.
Shares therefore compete within a broader capital ecosystem rather than within equity markets alone.
Behavioral Lag Effects
Behavioral interpretation typically lags structural adjustment.
Early repricing phases are interpreted as temporary. Later phases trigger emotional capitulation. Media narratives often attach explanatory labels only after denominator expansion has progressed.
Behavior does not initiate most structural cycles, but it can amplify volatility during later stages.
Understanding the lag between structural shift and psychological recognition reduces misinterpretation of price movement.
Long-Term Implications of Structural Cycles
Over extended horizons, equity markets tend to reflect cumulative earnings growth. However, medium-term valuation fluctuations are largely driven by required return adjustments.
Structural cycles do not eliminate long-term compounding. They introduce periodic recalibration.
Markets oscillate between phases of:
- Discount rate compression
- Risk premium narrowing
- Duration extension
- Recalibration
- Liquidity contraction
- Stabilization
The architecture repeats across decades because the fundamental valuation equation remains constant.
Required return assumptions change. Discounting changes. Prices adjust.
Why Structural Understanding Matters
Structural analysis does not forecast exact turning points. It clarifies mechanisms.
When shares reprice violently:
- It is rarely a single headline.
- It is rarely purely emotional.
- It is rarely isolated to one company.
More often, it reflects denominator expansion interacting with liquidity contraction.
Recognizing this distinction reframes volatility from randomness to recalibration.
Final Synthesis
Shares represent discounted expectations of future cash flows. Those expectations are filtered through required return assumptions composed of base interest rates and equity risk premiums.
When required returns rise, valuation compresses. When liquidity tightens, compression accelerates. When duration exposure is elevated, sensitivity increases. When leverage is widespread, volatility amplifies. When behavioral lag persists, misinterpretation follows.
Structural repricing therefore reflects the interaction of macro policy, capital allocation, and mathematical discounting within a human behavioral environment.
Markets move forward, not backward. Repricing occurs before confirmation. Stabilization emerges after recalibration.
Understanding the architecture does not eliminate risk. It clarifies the mechanism.
For interactive modeling, explore the complete Finance Tools suite available here.
Frequently Asked Questions
Why do shares fall when interest rates rise?
When interest rates rise, required returns increase. Higher discount rates reduce the present value of future cash flows, causing valuation compression even if company earnings remain stable.
What is equity risk premium in simple terms?
The equity risk premium is the additional return investors require for holding stocks instead of risk-free government bonds. It reflects compensation for uncertainty and volatility.
Why do growth stocks fall more during tightening cycles?
Growth stocks derive much of their valuation from distant future earnings. When required returns rise, those future earnings are discounted more heavily, making growth shares more sensitive to rate changes.