


The simplest setup is a Google Form with a few study-session fields linked to a Google Sheet, so each submission becomes a new row you can review later. The value comes from consistency: if you log sessions the same way each time, the spreadsheet can show where your study time actually goes instead of relying on memory.
You do not need scripts or a complicated dashboard to make this useful. Start with date, subject, minutes, and one short note about what you worked on; add more fields only when they change a decision you can make from the data.
What the tracker should capture
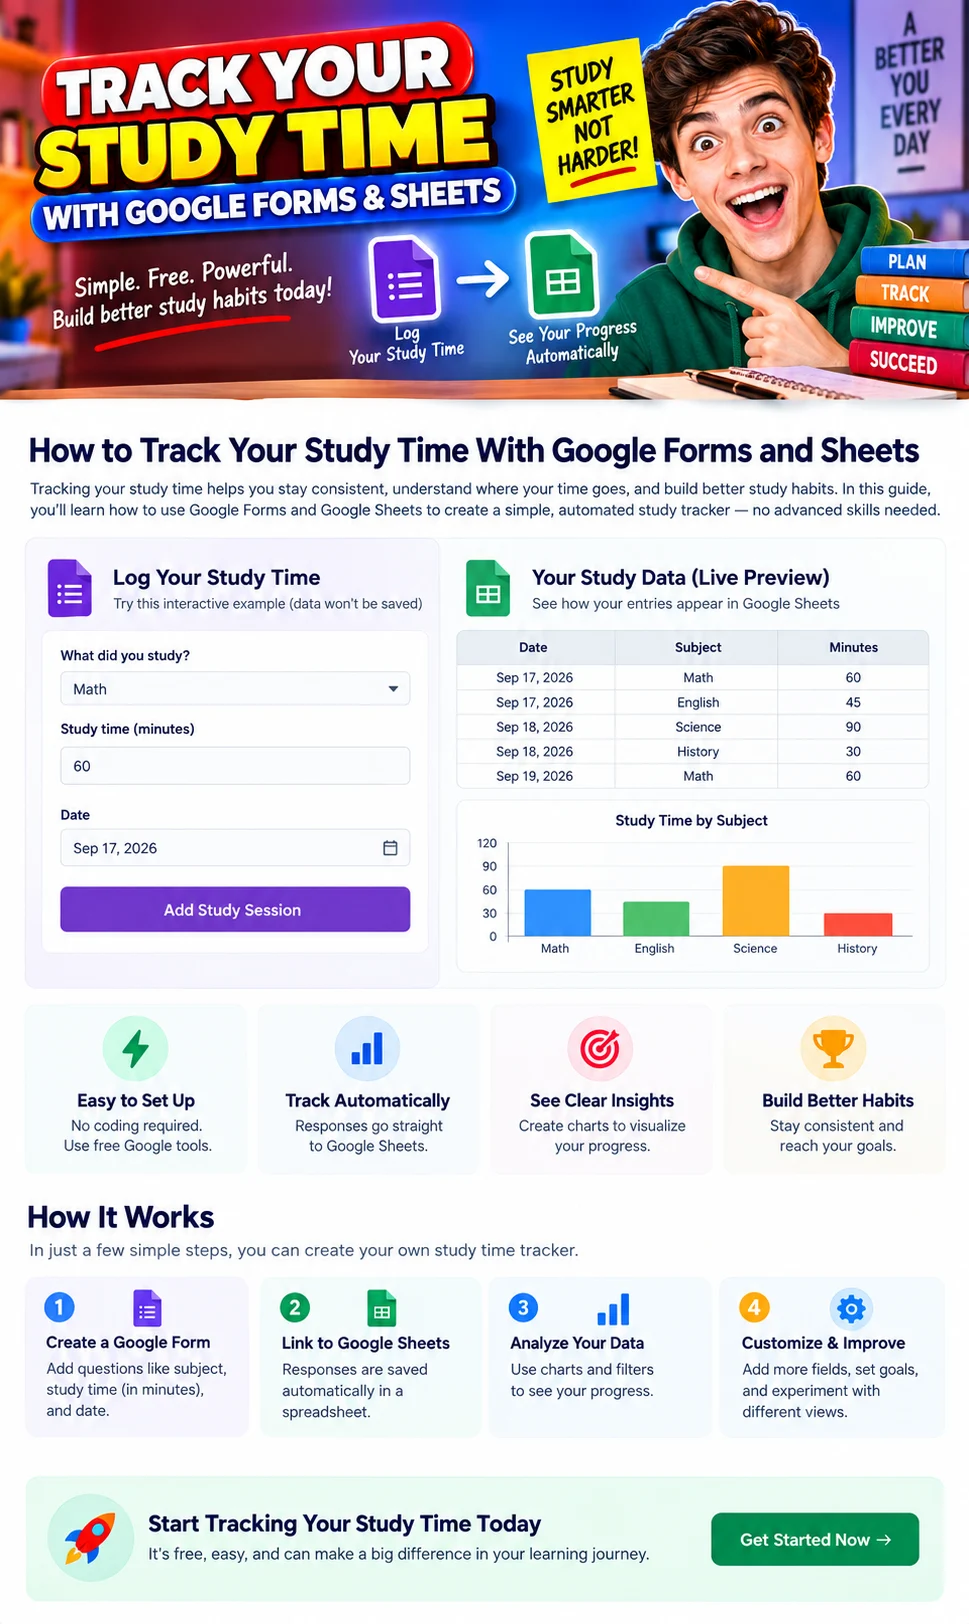
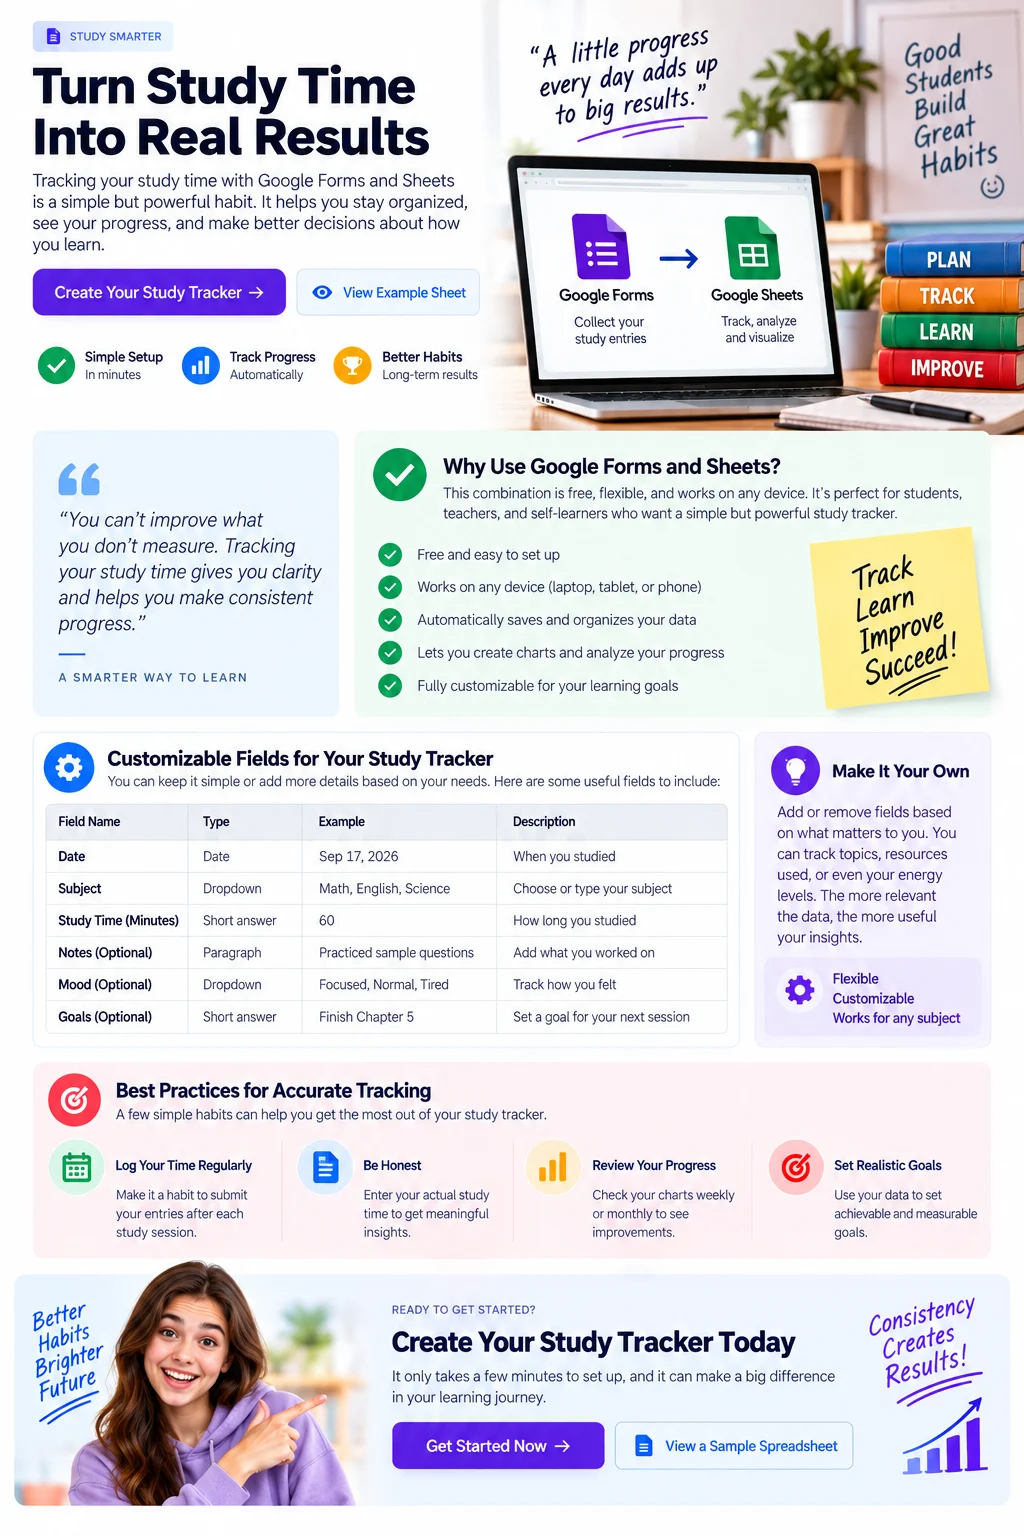
A useful study log records enough context to explain the time, but not so much that logging becomes another assignment. A strong starter form usually needs four fields: subject, study duration, date, and a brief description of the task. If you want to compare attention quality as well as time, add one small focus field such as Focused, Mixed, or Distracted.
- Subject: use a dropdown when you study the same subjects repeatedly, because consistent labels make summaries cleaner.
- Study time: enter minutes as a number so Sheets can total, average, and chart the values.
- Date: record when the session happened; Google Forms also records a submission timestamp automatically.
- What you worked on: keep this short enough to scan later, such as “Chapter 6 practice questions”.
- Optional focus: a simple categorical field can help explain why two sessions of the same length felt very different.

Turn study sessions into usable evidence
Study Rhythm Studio
Log a session, see where your time goes, and review your weekly pattern before you decide what to change.
Log one study session
This demo stores entries only in this browser using localStorage. It does not submit data to ExpertsGuys or Google.
Read your pattern
Review the session log
| Date | Subject | Minutes | Focus | Work | |
|---|---|---|---|---|---|
| No sessions yet. Add one above or load the example. | |||||
Use the log to ask better questions
Create the Google Form
Open Google Forms and create a blank form, then name it something obvious such as “Study Time Log.” Google’s current Forms help explains that a form can collect responses and send those responses to Sheets for deeper analysis, so the basic workflow is already built into the product rather than something you need to automate yourself.
- Add a Subject question. Use a dropdown if your subjects are stable, or short answer if they change often.
- Add Study time (minutes). Use a short-answer field and make it clear that the answer should be a number.
- Add Study date. A date question keeps the entry consistent.
- Add What did you work on? Use short answer or paragraph, depending on how much detail you want.
- If useful, add Focus with three choices such as Focused, Mixed, and Distracted.
Before you start using the form every day, submit two or three test sessions. That catches field-order problems and inconsistent labels before they become part of a larger spreadsheet.
Link the form to Google Sheets
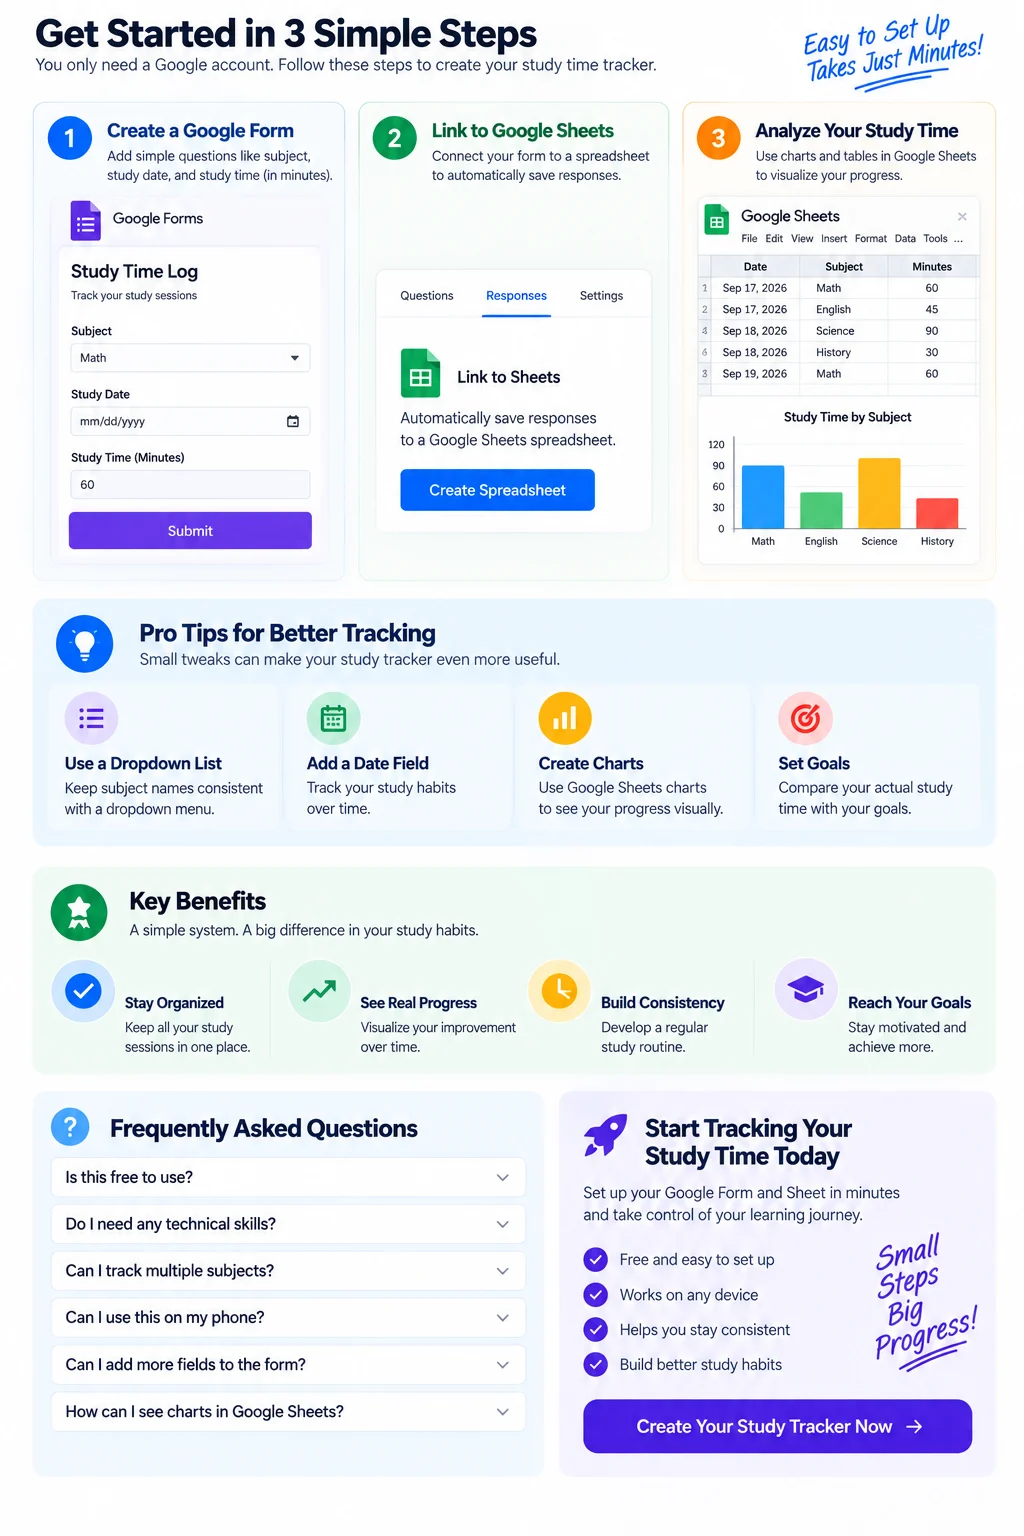
Open the form’s Responses area and connect it to a spreadsheet. Google documents two supported destinations: create a new spreadsheet or select an existing one; once linked, new form responses are stored in Sheets, where each submission becomes structured data you can filter, total, and chart.
If you are building the form from a spreadsheet instead, Google also supports creating a new form from Sheets. The practical choice is simple: start from Forms when the questions are the main design problem, and start from Sheets when you already have a workbook where the responses belong.
Keep the response sheet clean
The linked response tab should be treated as raw input. Avoid typing extra notes into random cells inside that table, because manual edits make formulas and filters harder to maintain. If you want summaries, charts, or weekly calculations, create a separate tab such as Dashboard or Weekly Review and reference the response data there.
| Need | Best place | Why |
|---|---|---|
| Raw form submissions | Form responses tab | Preserves the original response structure |
| Subject totals | Summary tab | Keeps calculations away from raw entries |
| Charts | Summary tab | Makes weekly review easier |
| Manual planning notes | Separate planning tab | Avoids mixing plans with measured sessions |
Turn minutes into a weekly review
The first useful calculation is total study time by subject. In Sheets, a pivot table is usually cleaner than building several one-off formulas because you can group rows by Subject and summarize the Minutes field. A simple bar chart built from that summary lets you see imbalance immediately, especially when one subject is absorbing far more time than the rest.
Do not treat a larger bar as automatically better. Study time is an input, not a learning outcome. If one subject takes twice as long but performance is not improving, the next question is whether the method, difficulty, feedback, or study environment needs to change.
What patterns are actually worth noticing?
- Consistency: are study sessions happening on the days you expected, or are they being compressed into one or two long sessions?
- Subject balance: does the time distribution match your priorities, deadlines, and weak areas?
- Focus quality: are long sessions frequently marked Mixed or Distracted?
- Task type: are you spending most of the time rereading, or are you also doing practice, recall, problem solving, and feedback?
- Outcome mismatch: is time increasing without a corresponding improvement in quiz, assignment, or recall performance?
Common setup mistakes
The most common problem is collecting too much detail. If your form asks for mood, energy, location, device, resource type, difficulty, confidence, distractions, sleep, and several notes, you may stop using it after a few days. Start with fields that answer a real question, then add one new field only when you know how you will use it.
Another problem is changing subject names. “Math,” “Mathematics,” and “Algebra” may all refer to the same course but will appear as different categories in a summary. Dropdowns reduce that inconsistency, which is why they are a good default when your subject list is predictable.
Finally, do not share a response summary casually if the form contains personal information. Google notes that response summaries can expose full-text answers or charts to people who can access the summary, so review sharing settings before turning on any results-sharing option.
When Google Forms and Sheets are enough
This setup is a strong fit when you want a low-friction personal log, a shared study record, or a simple class activity without installing another app. It is also easy to extend later: once you are comfortable with the workflow, you can explore Google Apps Script for automation, or use a similar Forms-to-Sheets pattern for recurring workflows such as emailing spreadsheets on a schedule.
If your goal is only to see how much time you spend, keep the system small. If your goal is to improve study quality, combine the time log with evidence from practice questions, assignments, recall checks, or other outcomes so you can judge whether the hours are producing useful learning.
FAQ
Can Google Forms automatically send study sessions to Sheets?
Yes. Link the form’s responses to a Google Sheet and new submissions can be stored there automatically. Google supports creating a new response spreadsheet or selecting an existing spreadsheet.
Should I track study time in hours or minutes?
Minutes are usually easier because the entries stay numeric without decimals. You can convert totals to hours later in Sheets when you want a weekly or monthly summary.
Do I need Apps Script for this?
No. The core workflow—form submission to linked spreadsheet—works without Apps Script. Scripts become useful only when you want custom automation beyond the built-in Forms and Sheets behavior.
What is the most useful chart for study time?
A bar chart of total minutes by subject is a good first view because differences are easy to compare. A weekly line chart becomes more useful when you want to see consistency over time.
Can I use the form on my phone?
Yes. A short form works well on a phone, which is one reason to avoid too many fields. The easier it is to submit immediately after a session, the more complete your log is likely to be.
Build the smallest tracker you will actually use
A study-time system becomes useful when it is easy enough to survive busy weeks. Create the form, link the sheet, log consistently, and review the pattern at a fixed interval; only then decide whether extra fields, charts, or automation would make the next decision clearer.