


RNA editing is a natural change in the messages cells copy from DNA. A blood test called EDIT-B measures some of those changes to help distinguish bipolar depression from major depressive disorder in adults already experiencing depression. Its result can inform a clinical assessment, but a positive or negative result alone cannot settle the diagnosis.
Why a blood sample might add information
Imagine arriving for an appointment during a month when getting out of bed has become difficult. A clinician can see how depression affects you today. The harder question is whether you have ever had a distinct period of mania or hypomania. An episode years ago can matter even if it ended before anyone thought to ask about it.
That gap gives a blood test a specific job. When a clinician is weighing two explanations for a depressive episode, does a measurable pattern make one explanation more plausible? This is a narrower question than whether a person has a mental health condition. For the broader clinical comparison, see how unipolar and bipolar depression differ.
The word “editing” can sound like a treatment. Here it describes chemistry that has already occurred in the body. In one common form, a cell converts adenosine in an RNA molecule into inosine. A laboratory can measure how often it sees that change at particular positions across many copies of a message. Taking the blood sample does not alter the patient’s DNA or RNA.
Researchers combined editing measurements from eight genes with clinical information. A model learned which combinations tended to accompany each diagnosis. The resulting classification reflects the inputs together. It cannot identify a single gene as the cause of one person’s depression or tell what was happening in the brain when an earlier episode began.
The clinical inputs also matter when reading a headline about a blood test. Age, substance use and classes of medication were among the information specified in the EDIT-B study protocol. An at-home DNA report or a routine blood count measures something different. Neither supplies the combination the researchers evaluated.

Who was in the study?
In the external validation, 393 adults at four centres in France, Spain and Denmark were experiencing a major depressive episode. Clinicians classified 155 as having bipolar disorder and 238 as having major depressive disorder. Researchers compared the test output with those clinical diagnoses. Testing a model in a new group matters because a rule can look unusually good in the group that helped researchers develop it.
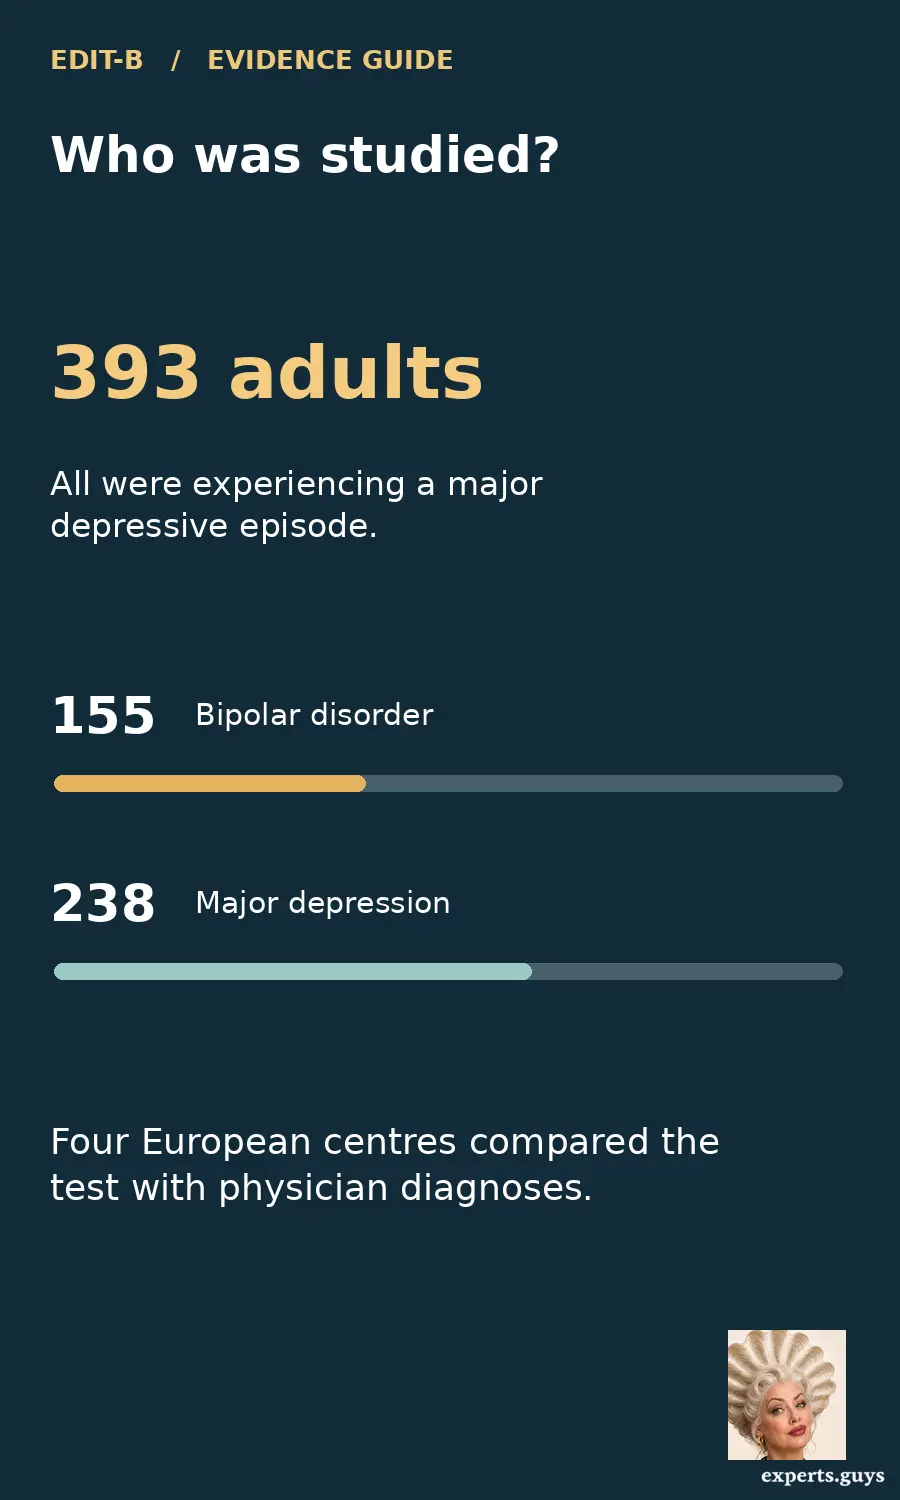
The comparison group is easy to overlook. The study asked whether the test could separate two groups of depressed adults. A comparison against healthy volunteers would have answered a less useful question for someone sitting in a clinic with substantial depression. Conversely, the results here cannot establish how well a test screens people who feel well or predicts a future first episode.
Eligibility narrowed the question further. For example, the protocol excluded people in the major-depression group who had a first-degree relative with bipolar disorder. A patient whose parent has bipolar disorder may be precisely the person for whom a clinician finds the distinction difficult. The published group average cannot tell that patient how often the test would be right in people with that same history.
How often did EDIT-B agree with the clinical diagnosis?
At the reported threshold, sensitivity was 82.6% and specificity was 80.3%. Each percentage starts with a different group of people. The table converts the published rates and group sizes into approximate whole-person counts so you can see both kinds of disagreement. Rounding accounts for small differences when converting back to percentages.
Read across a row to see what happened to people who shared a clinical diagnosis. Read down a column to see who received the same test result. That change in direction answers two quite different questions. The source for these calculations is the multicentre EDIT-B validation study.
| Clinical diagnosis | Bipolar flag | No bipolar flag | People |
|---|---|---|---|
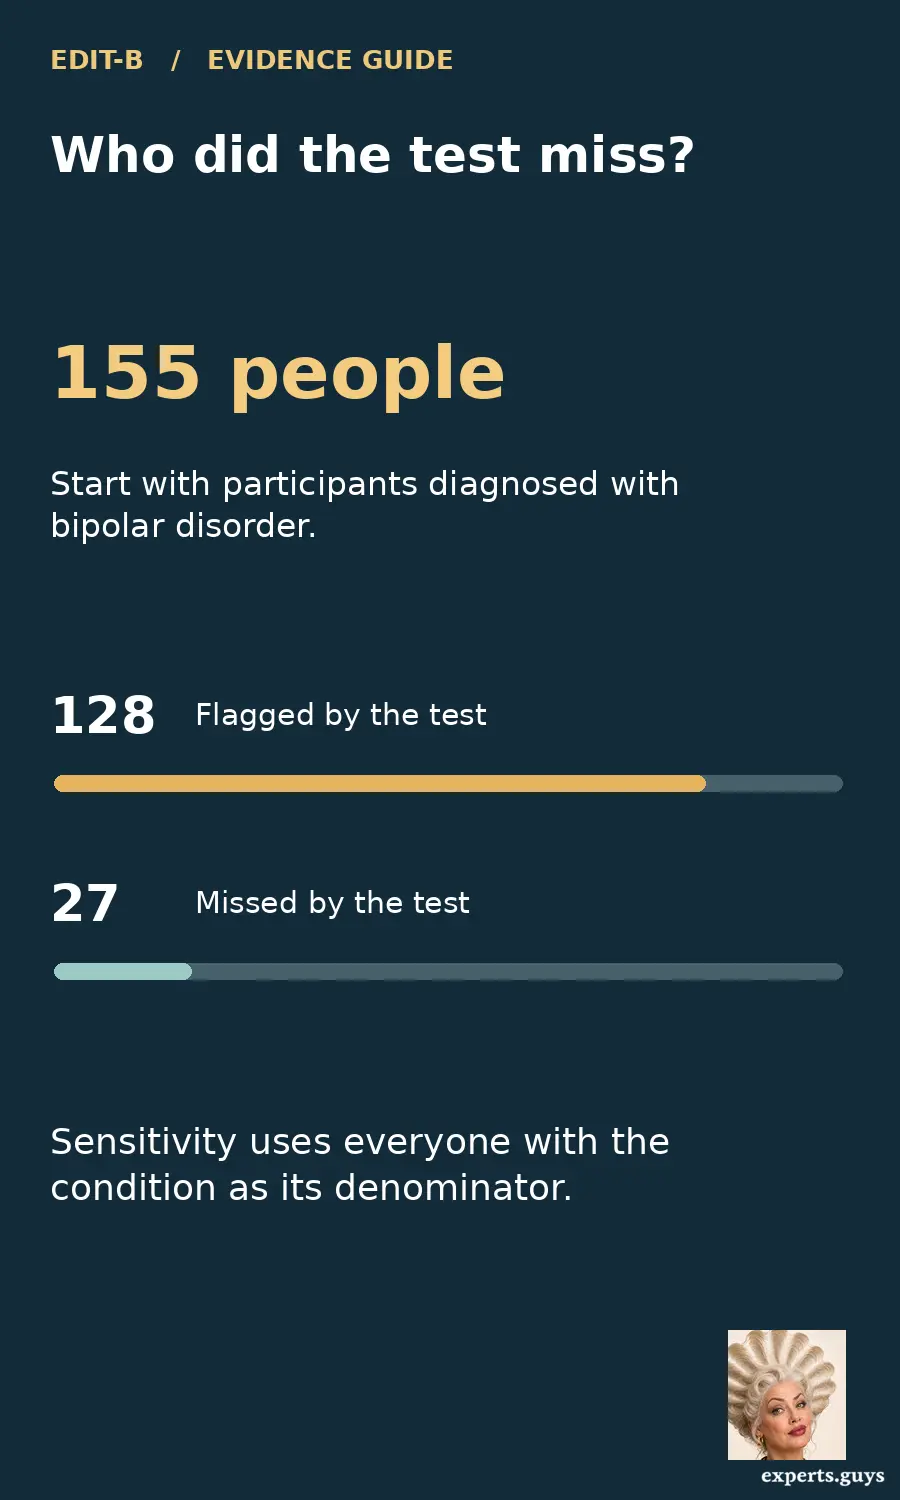
| Bipolar disorder | 128 | 27 | 155 |
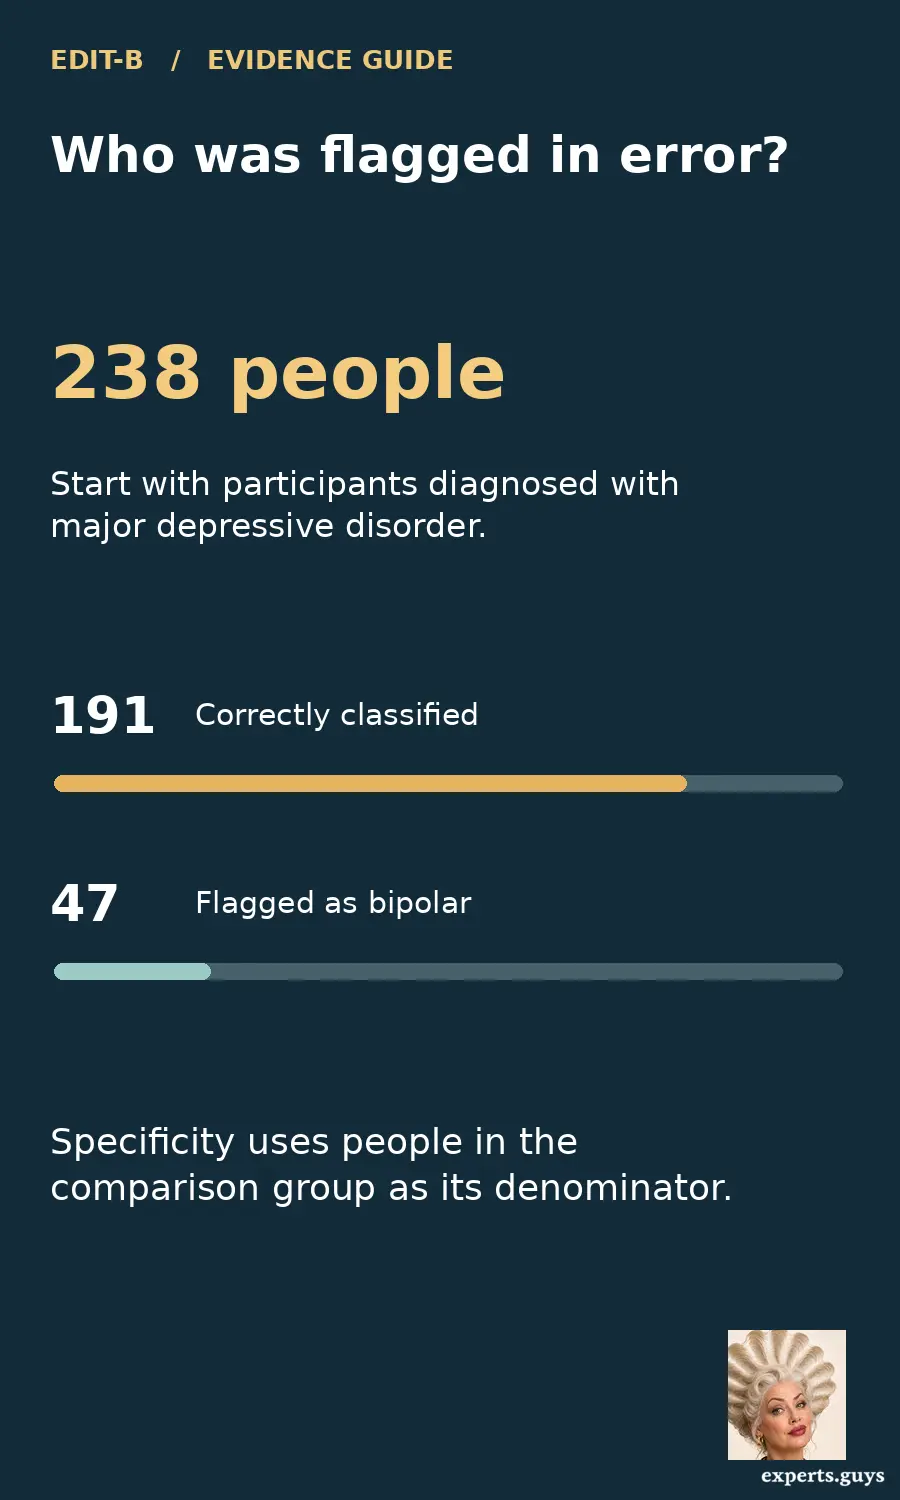
| Major depressive disorder | 47 | 191 | 238 |
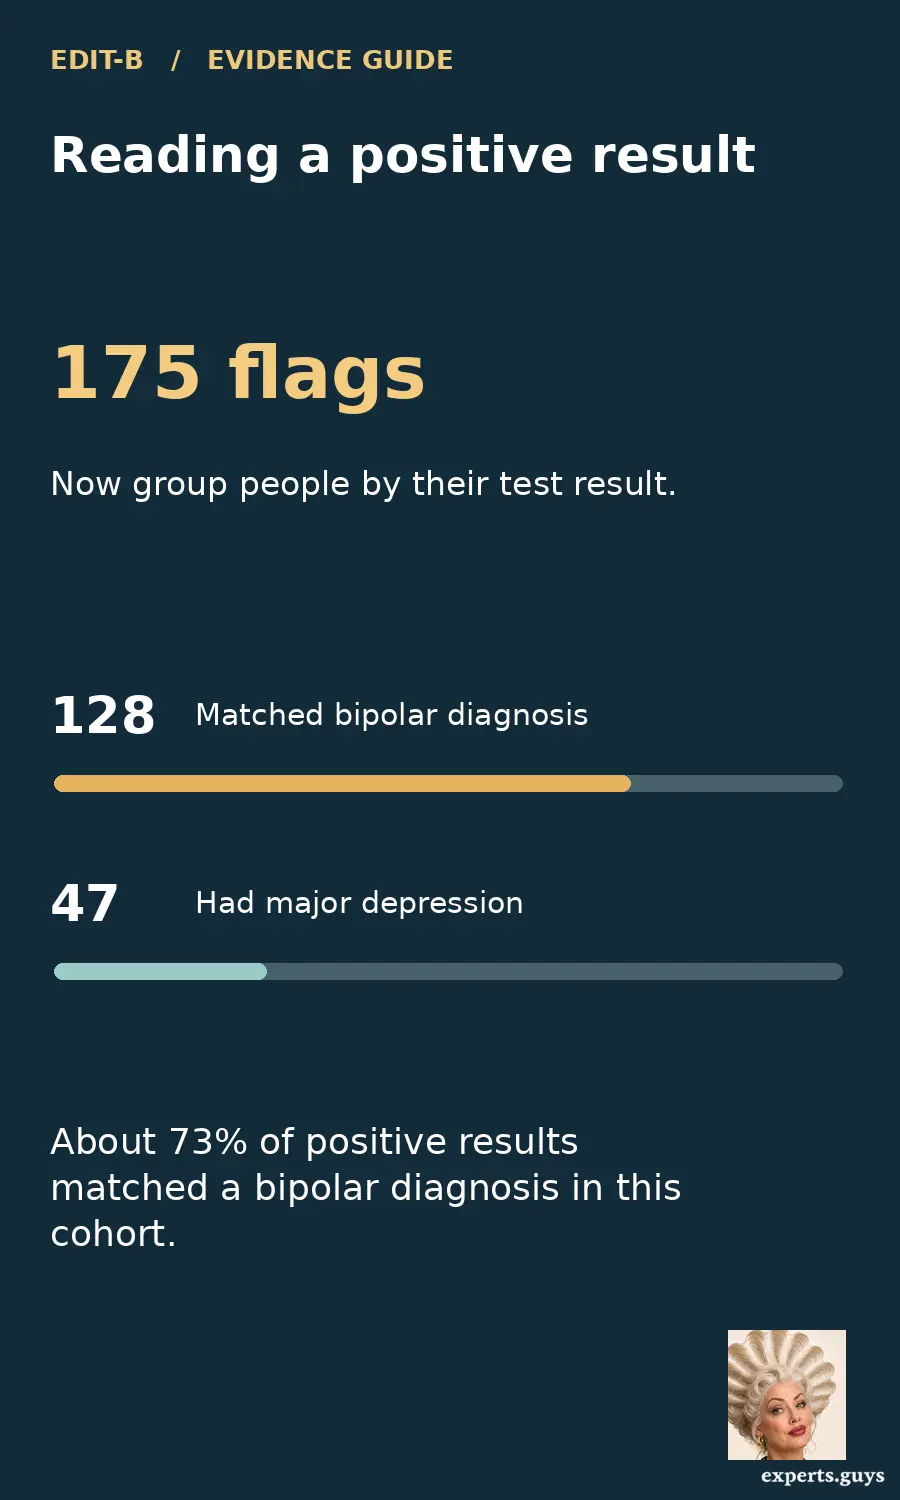
| Total | 175 | 218 | 393 |
Start with the 155 people diagnosed with bipolar disorder. About 128 received the matching flag. The other 27 illustrate why a negative result deserves particular care when a patient or someone close to them can describe a previous high-energy episode. A clinician still needs to establish what happened, how long it lasted and how different it was from the person’s usual behaviour.
Now start with the 238 people diagnosed with major depressive disorder. About 191 received the matching classification. The remaining 47 are the reason a positive result cannot, by itself, rewrite a person’s history. Here, “false positive” means disagreement with the physician diagnosis used in the study. It does not imply the person described their symptoms inaccurately.
A third number, the area under the receiver operating characteristic curve, was 0.873. Think of drawing one person from each diagnostic group. The number describes how often the model ranks the person from the bipolar group higher, allowing for ties. It is a measure of ranking across thresholds. It would be a mistake to tell a patient that their positive result means an 87.3% chance of bipolar disorder.
The estimates have uncertainty. The reported 95% confidence interval for sensitivity ranged from 75.7% to 88.2%, and for specificity from 74.6% to 85.1%. These ranges describe uncertainty around group performance. They do not attach a personalised range to a single person’s report.
- Sensitivity starts with people who have the clinical diagnosis and asks how many the test picked up.
- Specificity starts with the clinical comparison group and asks how many the test correctly left unflagged.
- Positive predictive value starts with everyone flagged and asks how many had the clinical diagnosis.
Why a positive result changes meaning across clinics
Suppose you are holding a positive result. You already know which column of the table you are in. There were about 175 people in that column, including 128 with a clinical bipolar diagnosis. Dividing 128 by 175 gives about 73%. For a negative result, the corresponding calculation is 191 divided by 218, or about 88% whose clinical diagnosis was major depressive disorder. Both estimates belong to this study population.
Consider a different waiting room. In a hypothetical group of 1,000 people, assume 100 have bipolar disorder and 900 have major depressive disorder. If the same test performance carried over, the test would flag about 83 of the 100 and about 177 of the 900. A positive result would match a bipolar diagnosis about 83 times out of 260, or 32%. The much larger comparison group supplies more chances for false positives.
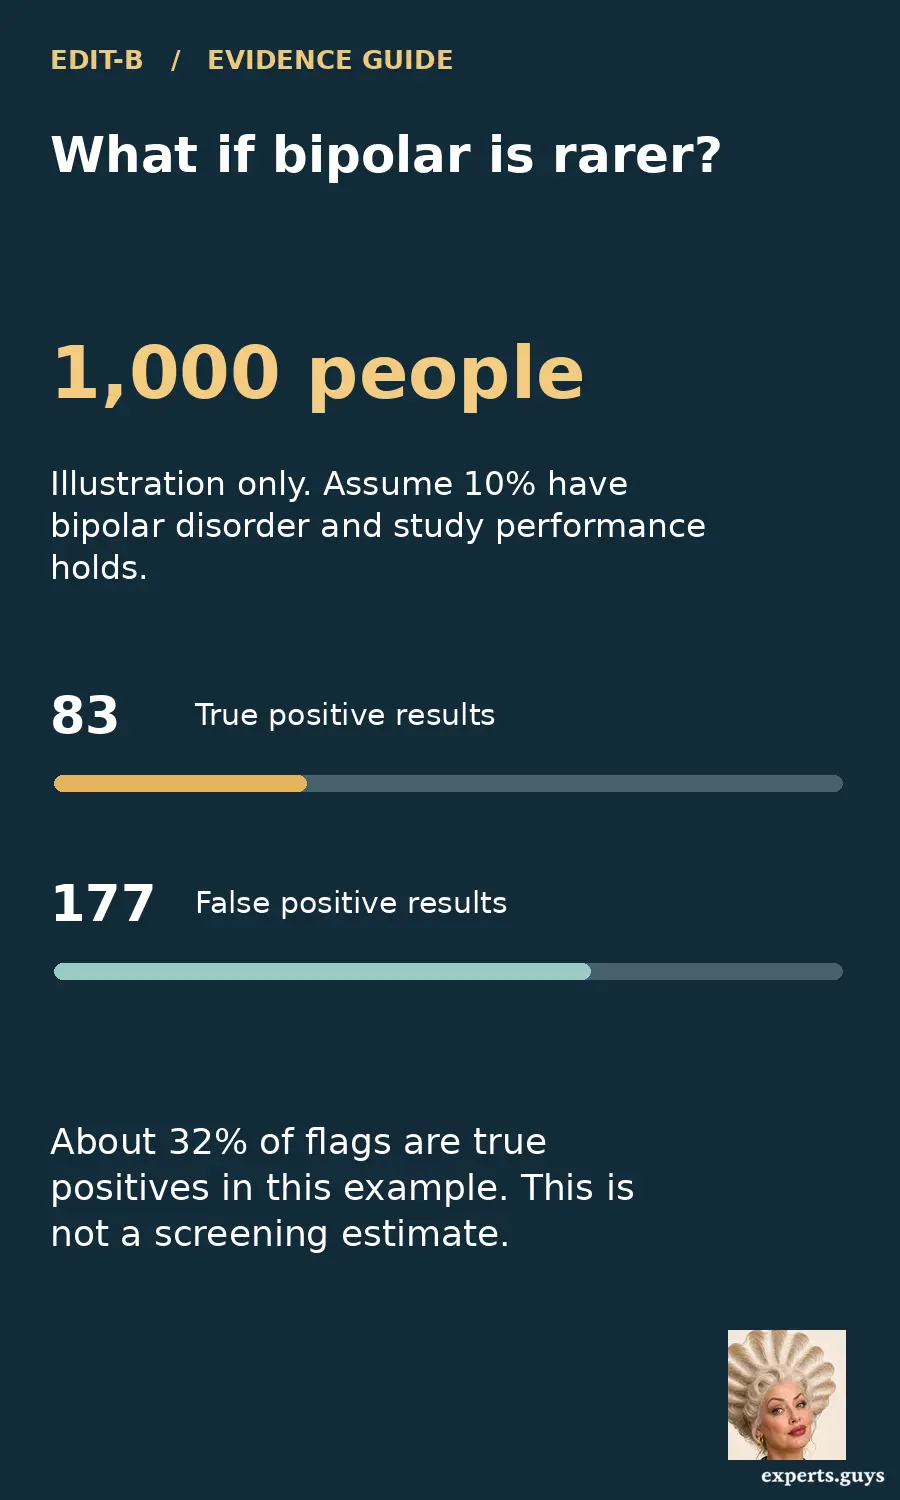
This example changes only the proportion of people with each diagnosis. Actual performance can also change if symptoms, treatment histories or reasons for referral differ. The illustration shows why applying a specialist clinic’s percentage to a workplace screening programme would require fresh evidence. It is not an estimate for either setting or for any individual reader.
What if the test and the episode history disagree?
During a consultation, ask the clinician to place the test result beside the episode history and explain each in turn. “Which part of my history supports this result? Which part makes you hesitate?” A specific example is easier to discuss than a general impression of mood swings. Someone who slept little because they were worrying and felt exhausted the next day describes something different from someone who needed very little sleep and felt unusually energised for several days.

| Situation | Question to ask | What the answer clarifies |
|---|---|---|
| Positive flag, no established history of elevated mood | Which earlier period would you want to explore? | Whether a clinical feature supports the flag. |
| Negative flag, credible history of a distinct change | How does that episode affect your interpretation? | Whether the clinical history carries more weight. |
| Result would leave the assessment unchanged | What decision would testing help us make? | Whether testing adds practical information. |
With permission, someone who knew you during the period in question may be able to describe a change you remember differently. An existing discharge summary may also clarify dates or context. The aim is to resolve one concrete uncertainty. You can have this conversation without keeping a diary, using an app or producing a detailed personal timeline.
Agreement with a clinical diagnosis and benefit to patients are separate research outcomes. This study compared classifications. It did not randomly assign people to care with or without the test and then show that testing shortened the time to effective treatment. To establish that benefit, researchers would need to follow what clinicians actually changed and what happened to patients afterward.
- Ask what decision is open before testing.
- Ask how either possible result would change the assessment.
- If a report conflicts with your history, ask who will review the discrepancy with you before any treatment decision.
Frequently asked questions
Can the result distinguish bipolar I from bipolar II?
The reported performance applies to bipolar disorder versus major depressive disorder. It does not provide a validated percentage for identifying an individual subtype. That distinction depends in particular on the nature and impact of past elevated episodes.
Does a blood relative’s diagnosis change how I should read the result?
Mention that history during assessment. The validation protocol placed restrictions on family history in its major-depression comparison group, so its percentages do not directly answer the question for every family.
Can I use the result to choose a medication?
The study tested diagnostic classification. It did not compare medications or identify which medicine would work for a particular person. Review any proposed medication change with your prescriber before acting on a report.
Can a result from a different laboratory test use these percentages?
Only if there is evidence that the test, inputs, decision threshold and intended patient group match. A different panel or scoring rule needs its own validation data. Ask for the study supporting the specific test being offered.
Next steps if you are offered an RNA-editing test
Before the blood draw, ask the ordering clinician to finish this sentence with you: “The decision this could change is …” A concrete answer might be to revisit a particular past episode with someone who witnessed it. If the result is already available, ask for the follow-up plan that fits both the report and your history. You should leave knowing which question has been resolved and which still needs a clinical answer.